![Which States Have the Most Bars? [MAP]](https://vinepair.com/wp-content/uploads/2022/06/bars_map_card-375x450.jpg "Which States Have the Most Bars? [MAP]")
From after-work happy hours to nights out with friends, bars play a steady role in the social lives of many Americans. Through gritty dive bars or swanky cocktail lounges, we explore new cities and relish in the warmth of local neighborhoods.
Bars are also a critical component of the hospitality industry, and provide stable employment for professionally trained bartenders and aspiring experts alike. While it’s unsurprising that states with cities that contain large metro populations (like New York or Texas) would have a greater number, it’s interesting to note that the bar scene flourishes to different degrees nationwide.
Location, general population size, and post-Prohibition liquor laws all play a factor in the number of bars a state can house — the latter especially true for control states, which oversee liquor sales instead of providing private licenses. To avoid being classified as a bar meant only for alcohol sales, restaurants in New Hampshire, for example, serve alcohol more frequently.
Supporting data sourced from the United States Census Bureau shows that several of the 17 control states (along with New Hampshire) have fewer bars, likely due to how they are classified and reported. The data, which tracks county business patterns, come from a range of sources including the Economic Census, the Annual Survey of Manufactures, and Current Business Surveys, and records from administrations like Social Security and the Internal Revenue Service.
But even with the foggy legalities surrounding alcohol distribution, the number of bars or establishments serving alcohol is bound to increase. So, which states are packed with watering holes? Take a look below to find out to satisfy your curiosity — you may be surprised to see just how many occupy your current or home state.
Source: United States Census Bureau
Data Year: 2019
Note: Outliers may be a representation of how data is reported to the United States Census Bureau
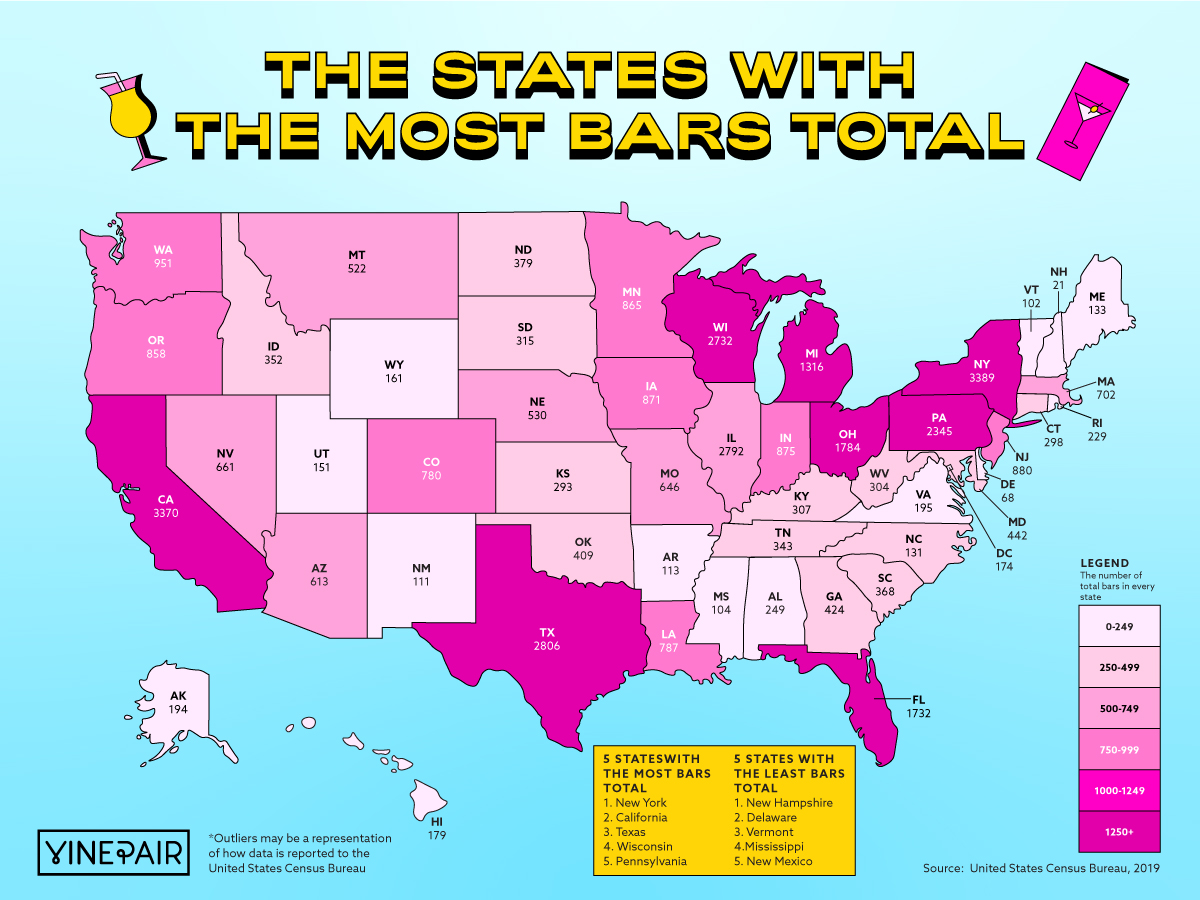
The Number of Bars By State
| State | # of Bars |
|---|---|
| Alabama | 249 |
| Alaska | 146 |
| Arizona | 613 |
| Arkansas | 113 |
| California | 3,370 |
| Colorado | 780 |
| Connecticut | 298 |
| Delaware | 68 |
| Florida | 1,732 |
| Georgia | 424 |
| Hawaii | 179 |
| Idaho | 352 |
| Illinois | 2,792 |
| Indiana | 875 |
| Iowa | 871 |
| Kansas | 293 |
| Kentucky | 307 |
| Louisiana | 787 |
| Maine | 133 |
| Maryland | 442 |
| Massachusetts | 702 |
| Michigan | 1,316 |
| Minnesota | 865 |
| Mississippi | 104 |
| Missouri | 646 |
| Montana | 522 |
| Nebraska | 530 |
| Nevada | 661 |
| New Hampshire | 21 |
| New Jersey | 880 |
| New Mexico | 111 |
| New York | 3,389 |
| North Carolina | 765 |
| North Dakota | 379 |
| Ohio | 1,784 |
| Oklahoma | 409 |
| Oregon | 858 |
| Pennsylvania | 2,345 |
| Rhode Island | 229 |
| South Carolina | 368 |
| South Dakota | 315 |
| Tennessee | 343 |
| Texas | 2,806 |
| Utah | 151 |
| Vermont | 102 |
| Virginia | 195 |
| Washington | 951 |
| Washington D.C. | 174 |
| West Virginia | 304 |
| Wisconsin | 2,732 |
| Wyoming | 161 |
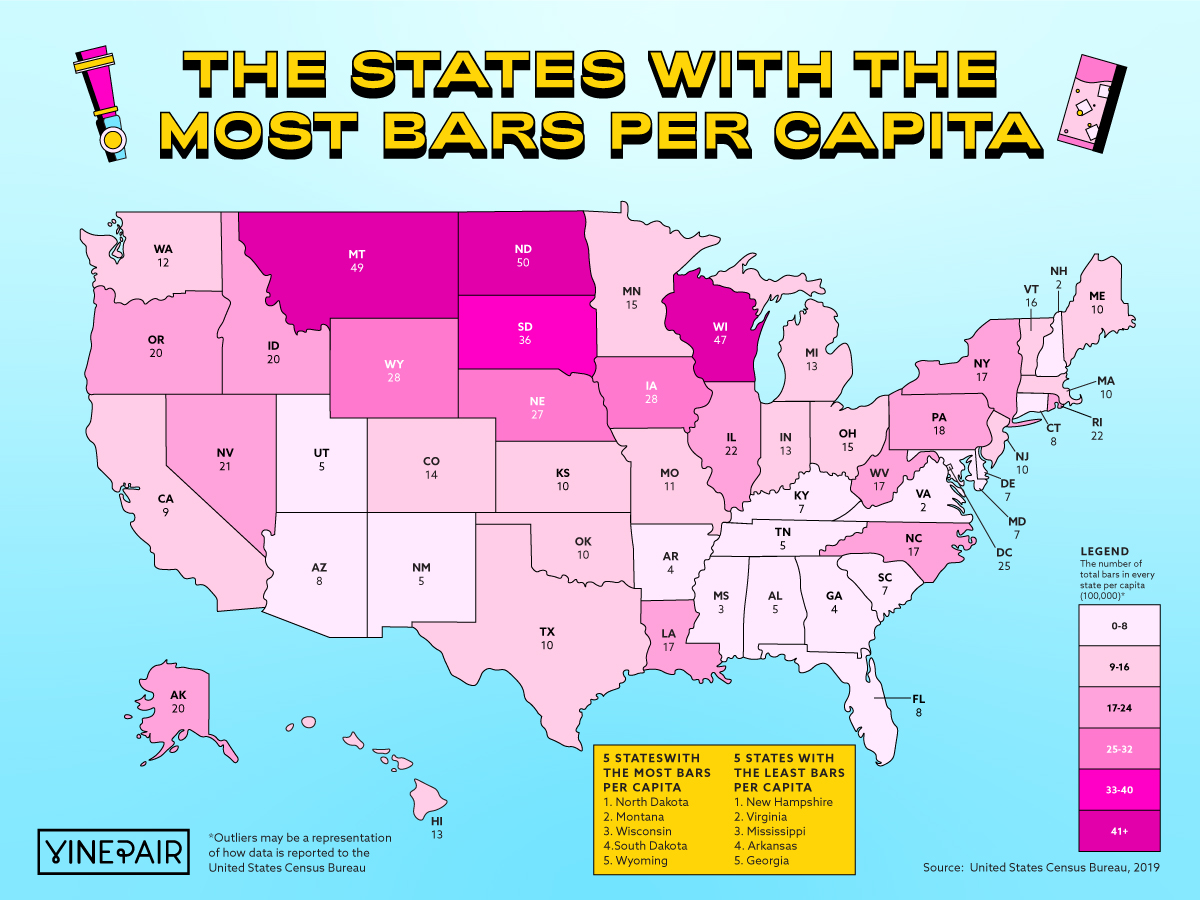
The Number of Bars Per Capita By State
| State | Per Capita (100,000) |
|---|---|
| Alabama | 5.08 |
| Alaska | 19.96 |
| Arizona | 8.42 |
| Arkansas | 3.74 |
| California | 8.53 |
| Colorado | 13.54 |
| Connecticut | 8.36 |
| Delaware | 6.98 |
| Florida | 8.06 |
| Georgia | 3.99 |
| Hawaii | 12.64 |
| Idaho | 19.70 |
| Illinois | 22.03 |
| Indiana | 13.00 |
| Iowa | 27.61 |
| Kansas | 10.06 |
| Kentucky | 6.87 |
| Louisiana | 16.93 |
| Maine | 9.89 |
| Maryland | 7.31 |
| Massachusetts | 10.18 |
| Michigan | 13.18 |
| Minnesota | 15.34 |
| Mississippi | 3.49 |
| Missouri | 10.53 |
| Montana | 48.84 |
| Nebraska | 27.40 |
| Nevada | 21.46 |
| New Hampshire | 1.54 |
| New Jersey | 9.91 |
| New Mexico | 5.29 |
| New York | 17.42 |
| North Carolina | 7.29 |
| North Dakota | 49.73 |
| Ohio | 15.26 |
| Oklahoma | 10.34 |
| Oregon | 20.34 |
| Pennsylvania | 18.32 |
| Rhode Island | 21.62 |
| South Carolina | 7.15 |
| South Dakota | 35.61 |
| Tennessee | 5.02 |
| Texas | 9.68 |
| Utah | 4.71 |
| Vermont | 16.35 |
| Virginia | 2.28 |
| Washington | 12.49 |
| Washington D.C. | 24.65 |
| West Virginia | 16.96 |
| Wisconsin | 46.92 |
| Wyoming | 27.82 |