![The States That Drink the Most Beer in America [MAP] (2025)](https://vinepair.com/wp-content/uploads/2026/05/states-that-drink-the-most-beer-card-375x450.jpg "The States That Drink the Most Beer in America [MAP] (2025)")
Beer still reigns as the country’s most consumed alcoholic beverage by volume, according to data from the National Institute on Alcohol Abuse and Alcoholism (NIAAA). In 2023 — the most recent year of data available — Americans drank 6.2 billion gallons of beer, a 3 percent dip in total consumption from 2022. Still, the category topped wine (887 million gallons) and spirits (734 million gallons) by volume.
The South — the NIAAA demarcates its regions in line with the U.S. Census Bureau — knocked back the most beer by a long shot with 2.3 billion gallons consumed. That’s over 1.3 billion gallons more than the Northeast, where constituents drank the least beer at 998 million gallons. The West drank the second- largest volume of beer with 1.5 billion gallons consumed, just a bit higher than the 1.2 billion drunk in the Midwest.
Check out our maps below to dive into state-by-state beer consumption both per capita and in total.
The States That Drink the Most Beer Per Capita
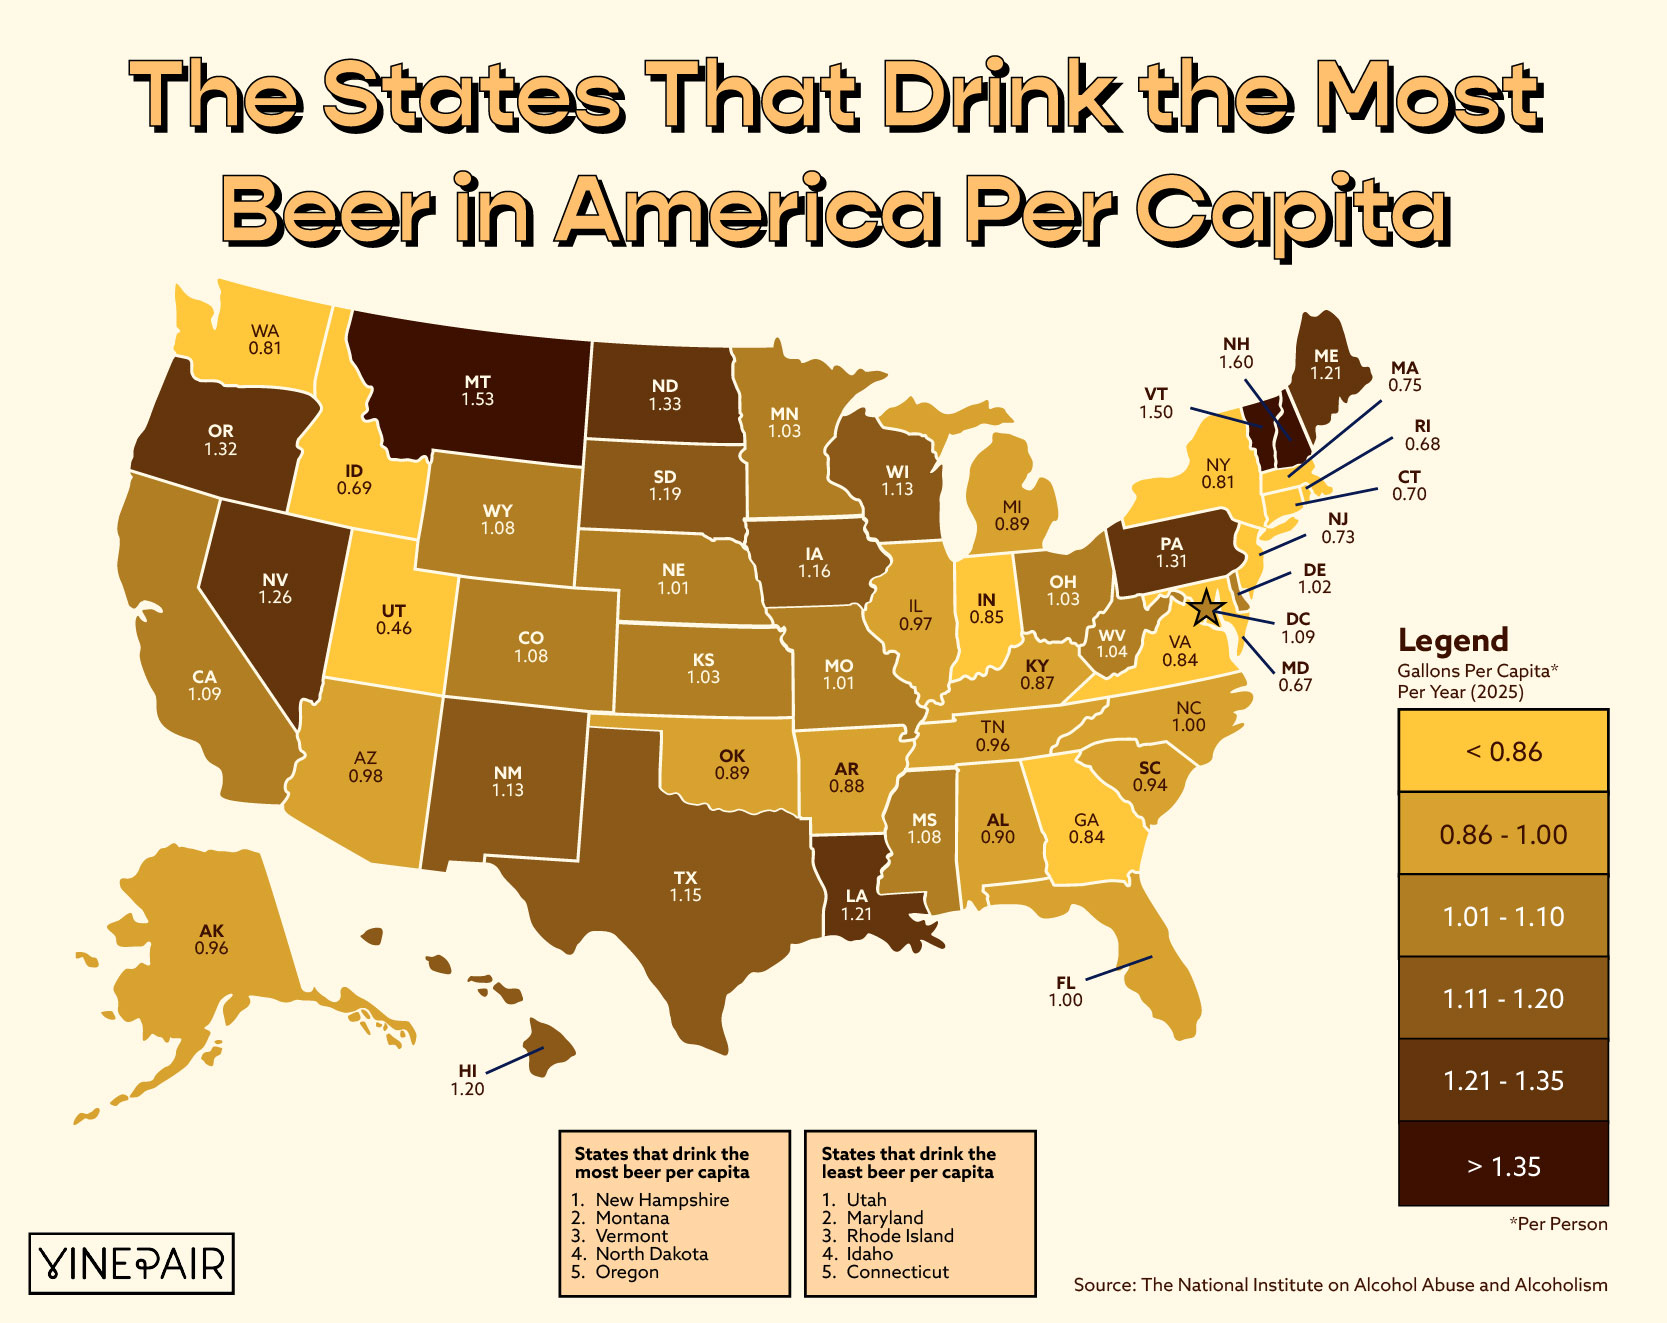
As with cross-category alcohol consumption, New Hampshire drank the most ethanol from beer per capita in 2023 at 1.6 gallons per person — likely due to the state’s lack of alcohol sales tax which brings in consumers from neighboring areas. Montana and Vermont — the latter boasts the most craft breweries of any other state — placed No. 2 and 3 with 1.53 and 1.50 gallons of ethanol per capita, respectively. Utah, which consistently ranks the lowest in per-capita consumption, ranks as predicted with only 0.46 gallons of ethanol per person.
The States That Drink the Most Beer in Ethanol
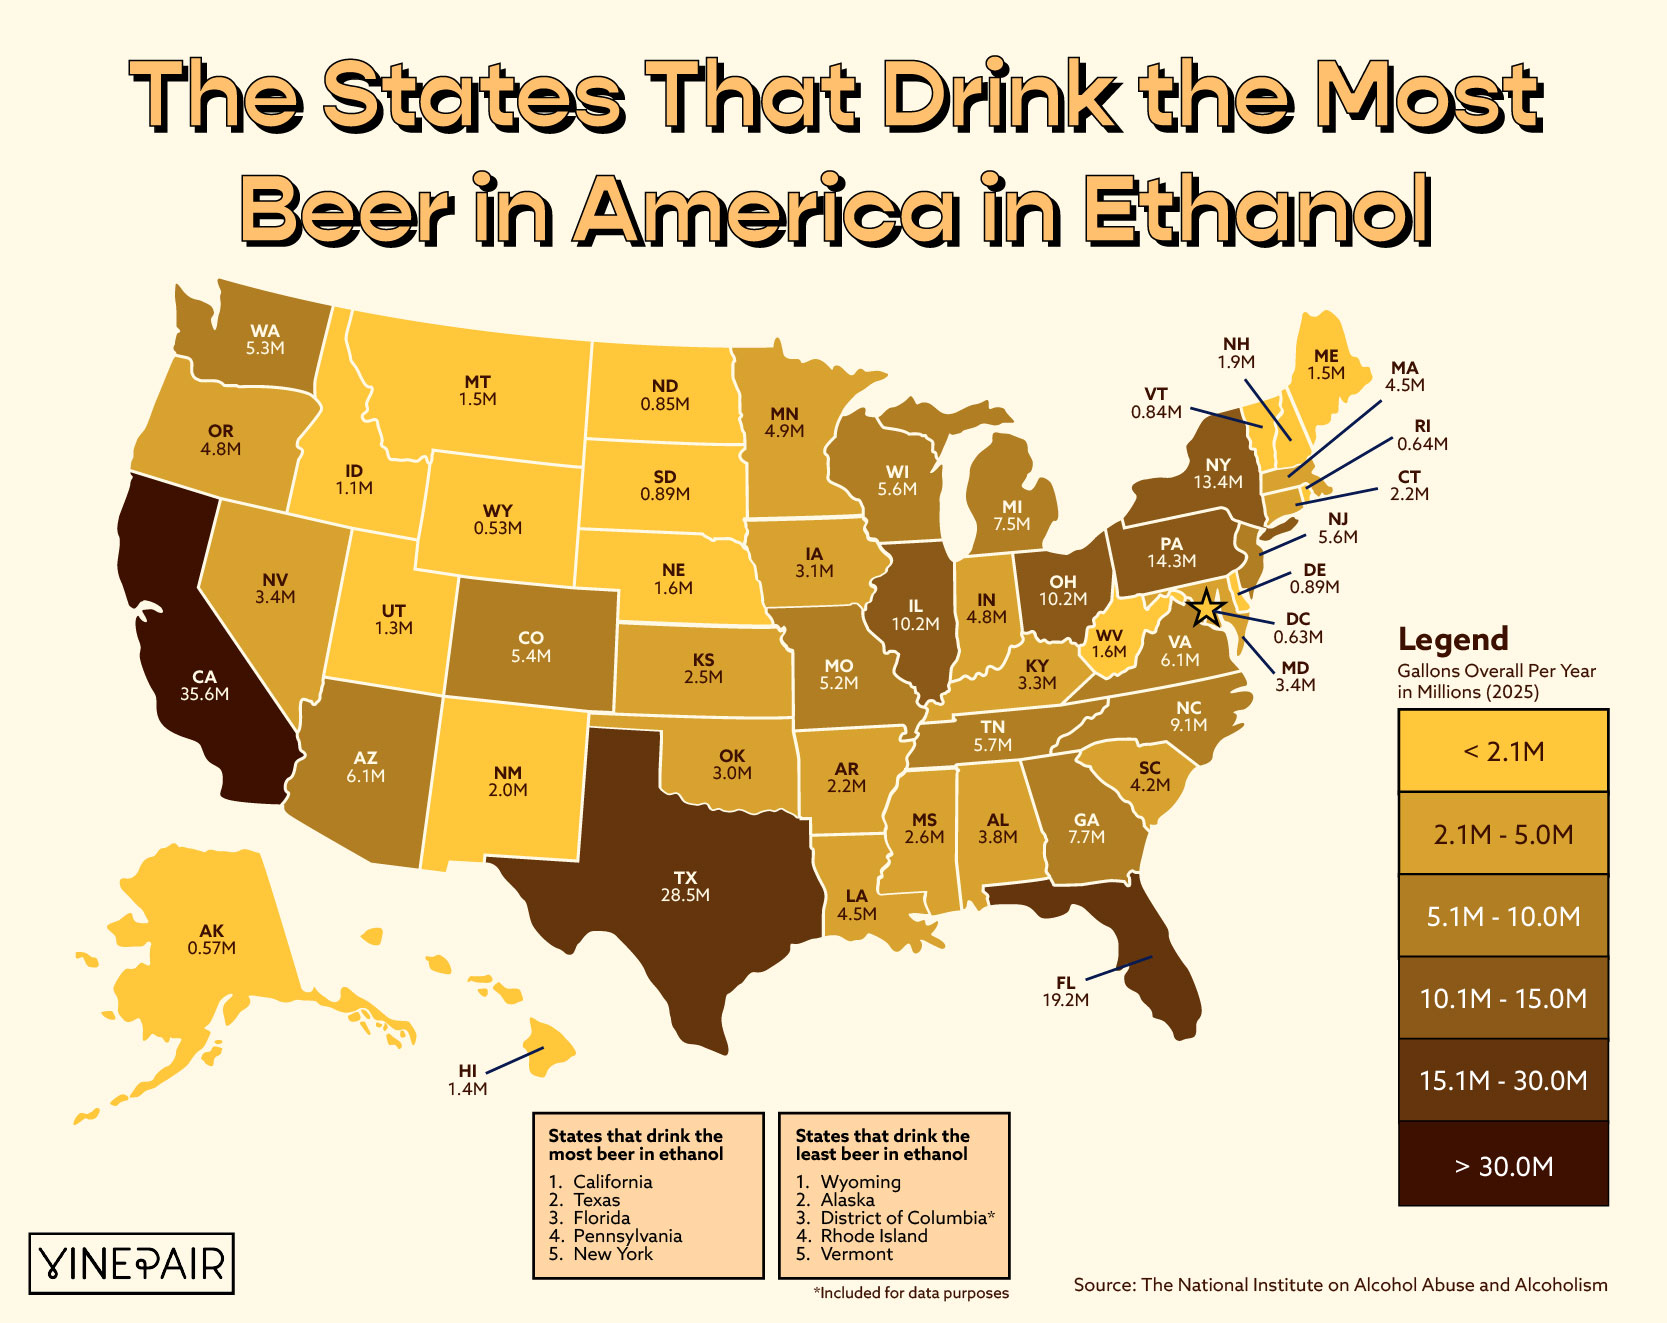
As expected, the largest and most densely populated states drank the highest quantity of ethanol from beer in total in 2023. California led the 50 states and Washington, D.C., by a mile with 35.6 million gallons of ethanol from beer. Behind it were Texas and Florida with 28.5 and 19.2 million gallons, respectively. Wyoming — the least populous state — consumed the smallest amount of ethanol from beer in total, with residents drinking only around 530,000 gallons.
Ranking the States
Gallons per Capita
| Rank | State | Gallons of Ethanol Per Capita |
|---|---|---|
| 1 | New Hampshire | 1.60 |
| 2 | Montana | 1.53 |
| 3 | Vermont | 1.50 |
| 4 | North Dakota | 1.33 |
| 5 | Oregon | 1.32 |
| 6 | Pennsylvania | 1.31 |
| 7 | Nevada | 1.26 |
| 8 | Lousiana | 1.21 |
| 9 | Maine | 1.21 |
| 10 | Hawaii | 1.20 |
| 11 | South Dakota | 1.19 |
| 12 | Iowa | 1.16 |
| 13 | Texas | 1.15 |
| 14 | New Mexico | 1.13 |
| 15 | Wisconsin | 1.13 |
| 16 | California | 1.09 |
| 17 | Washington, D.C. | 1.09 |
| 18 | Colorado | 1.08 |
| 19 | Mississippi | 1.08 |
| 20 | Wyoming | 1.08 |
| 21 | West Virginia | 1.04 |
| 22 | Kansas | 1.03 |
| 23 | Minnesota | 1.03 |
| 24 | Ohio | 1.03 |
| 25 | Delaware | 1.02 |
| 26 | Missouri | 1.01 |
| 27 | Nebraska | 1.01 |
| 28 | Florida | 1.00 |
| 29 | North Carolina | 1.00 |
| 30 | Arizona | 0.98 |
| 31 | Illinois | 0.97 |
| 32 | Alaska | 0.96 |
| 33 | Tennessee | 0.96 |
| 34 | South Carolina | 0.94 |
| 35 | Alabama | 0.90 |
| 36 | Michigan | 0.89 |
| 37 | Oklahoma | 0.89 |
| 38 | Arkansas | 0.88 |
| 39 | Kentucky | 0.87 |
| 40 | Indiana | 0.85 |
| 41 | Georgia | 0.84 |
| 42 | Virginia | 0.84 |
| 43 | New York | 0.81 |
| 44 | Washington | 0.81 |
| 45 | Massachusetts | 0.75 |
| 46 | New Jersey | 0.73 |
| 47 | Connecticut | 0.70 |
| 48 | Idaho | 0.69 |
| 49 | Rhode Island | 0.68 |
| 50 | Maryland | 0.67 |
| 51 | Utah | 0.46 |
Gallons Overall
| Rank | State | Gallons of Beer in Ethanol Overall (M) |
|---|---|---|
| 1 | California | 35.6 |
| 2 | Texas | 28.5 |
| 3 | Florida | 19.2 |
| 4 | Pennsylvania | 14.3 |
| 5 | New York | 13.4 |
| 6 | Illinois | 10.2 |
| 7 | Ohio | 10.2 |
| 8 | North Carolina | 9.1 |
| 9 | Georgia | 7.7 |
| 10 | Michigan | 7.5 |
| 11 | Arizona | 6.1 |
| 12 | Virginia | 6.1 |
| 13 | Tennessee | 5.7 |
| 14 | New Jersey | 5.6 |
| 15 | Wisconsin | 5.6 |
| 16 | Colorado | 5.4 |
| 17 | Washington | 5.3 |
| 18 | Missouri | 5.2 |
| 19 | Minnesota | 4.9 |
| 20 | Indiana | 4.8 |
| 21 | Oregon | 4.8 |
| 22 | Louisiana | 4.5 |
| 23 | Massachusetts | 4.5 |
| 24 | South Carolina | 4.2 |
| 25 | Alabama | 3.8 |
| 26 | Maryland | 3.4 |
| 27 | Nevada | 3.4 |
| 28 | Kentucky | 3.3 |
| 29 | Iowa | 3.1 |
| 30 | Oklahoma | 3.0 |
| 31 | Mississippi | 2.6 |
| 32 | Kansas | 2.5 |
| 33 | Arkansas | 2.2 |
| 34 | Connecticut | 2.2 |
| 35 | New Mexico | 2.0 |
| 36 | New Hampshire | 1.9 |
| 37 | Nebraska | 1.6 |
| 38 | West Virginia | 1.6 |
| 39 | Maine | 1.5 |
| 40 | Montana | 1.5 |
| 41 | Hawaii | 1.4 |
| 42 | Utah | 1.3 |
| 43 | Idaho | 1.1 |
| 44 | Delaware | 0.89 |
| 45 | South Dakota | 0.89 |
| 46 | North Dakota | 0.85 |
| 47 | Vermont | 0.84 |
| 48 | Rhode Island | 0.64 |
| 49 | Washington, D.C. | 0.63 |
| 50 | Alaska | 0.57 |
| 51 | Wyoming | 0.53 |
*Image retrieved from Meritt Thomas via unsplash.com
