![The States That Drink the Most Alcohol in America [MAP] (2025)](https://vinepair.com/wp-content/uploads/2026/05/states-that-drink-the-most-alcohol-card-375x450.png "The States That Drink the Most Alcohol in America [MAP] (2025)")
A Gallup survey shows the number of Americans who drink alcohol was in consistent decline between 2022 and 2025. Fewer people imbibing directly correlates to a drop in the yearly volume of alcohol the country consumes, and data from 2023 on the country’s drinking habits from the National Institute on Alcohol Abuse and Alcoholism (NIAAA) reflects the waning consumption.
In 2023 — the most recent year of NIAAA’s available data — the U.S. drank 7.7 billion total gallons of alcohol across beer, wine, and spirits, a nearly 15 million-gallon dip from the country’s total cross-category consumption the previous year. NIAAA attributes much of that slide to noticeable contractions in beer’s and wine’s figures: Americans consumed 6.1 billion gallons of beer and 887.9 million gallons of wine, down from 6.3 billion and 910.3 million in 2022, respectively. Spirits was the only one of the three categories to see growth, with 734.2 million gallons consumed in 2023, up from 715.2 million gallons the previous year.
The three categories’ standings reverse order when looking at per capita consumption in 2023. Roughly 1.08 gallons of ethanol from spirits, 0.99 gallons from beer, and 0.41 gallons from wine per capita were consumed in 2023.
Region-by-region differences are comparably stark. The South — NIAAA demarcates its regions as defined by the U.S. Census Bureau — drank 2.9 billion gallons of alcohol in 2023, roughly 1 billion gallons more than the West, the second-wettest region. The Midwest and Northeast trailed behind at 1.5 and 1.3 billion gallons, respectively. The West and the Northeast drank the most per capita at 2.7 and 2.5 gallons, respectively.
Check our maps below to see how much Americans drank state by state both per capita and in total.
The States That Drink the Most Alcohol Per Capita
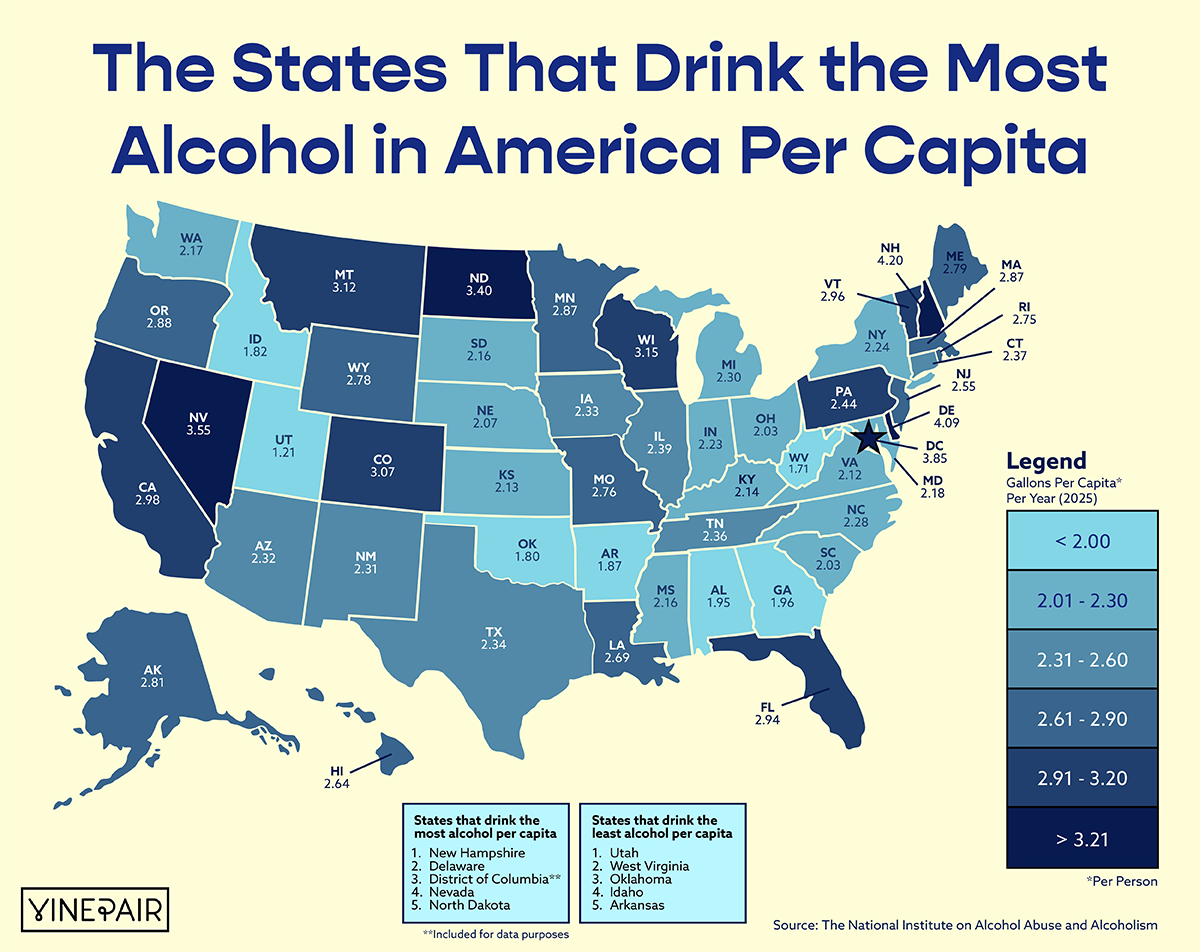
New Hampshire and Delaware led the 50 states and Washington, D.C., in ethanol consumption per capita at 4.2 and 4.09 gallons, respectively. They were the only states to surpass 4 gallons per person in 2023. Behind them are D.C. (3.85 gallons per person), Nevada (3.55 gallons per person), and North Dakota (3.4 gallons per person). New Hampshire consistently ranks in the top spot in per-capita ethanol drinking, likely due to the state’s lack of alcohol sales tax that lures in consumers from surrounding jurisdictions. As was the case in 2022, Utah reported the lowest volume in ethanol consumption at 1.21 gallons per capita.
The States That Drink the Most Alcohol in Ethanol
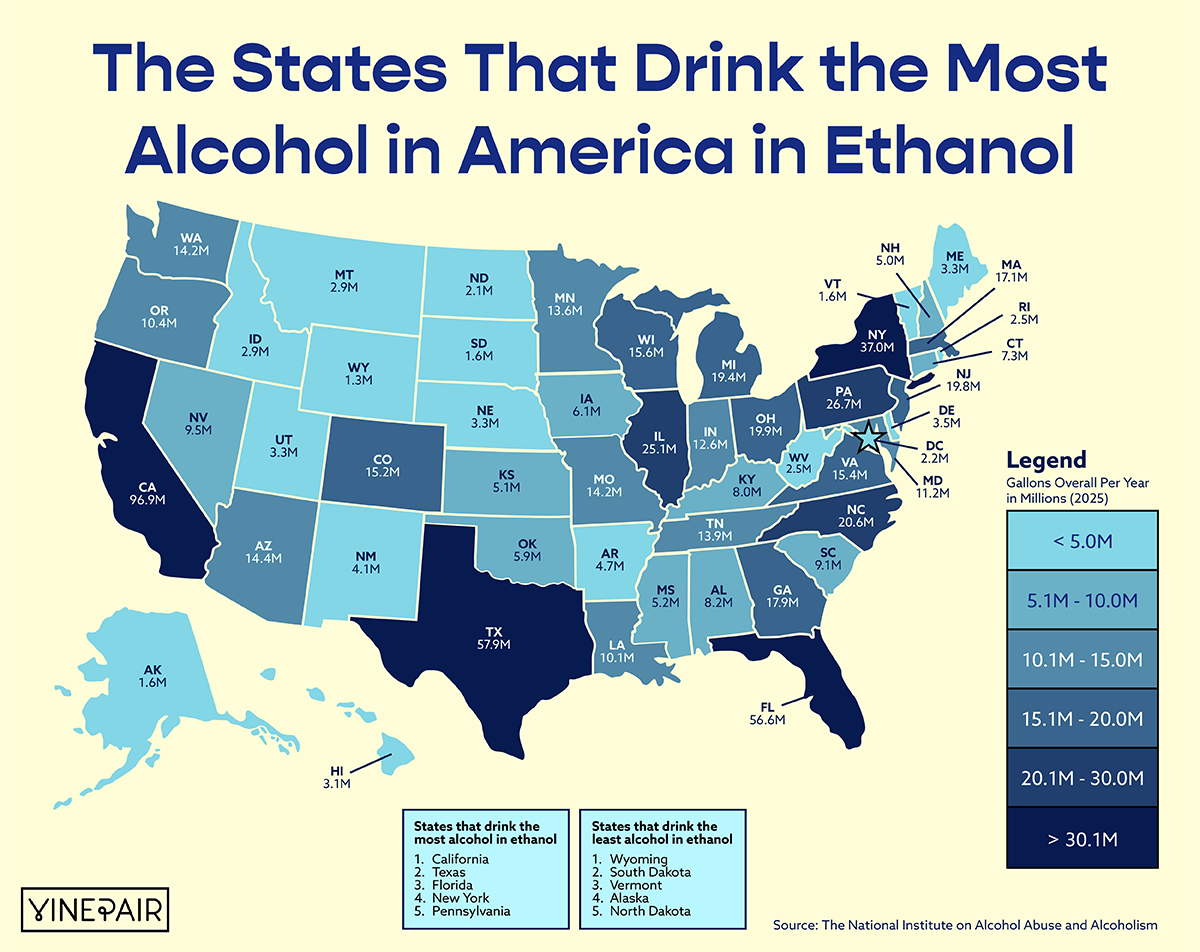
As intuition would predict, the larger and more densely populated states consumed the most ethanol. California led the pack with 96.9 million gallons. Texas came in second at 57.9 million gallons, with Florida (56.6 million gallons) nipping at its heels. Wyoming, where constituents drank just 1.3 million gallons of alcohol, was the driest state. South Dakota, Vermont, and Alaska came out in the penultimate spot, each consuming 1.6 million gallons of alcohol.
Ranking the States
Gallons Per Capita
| Rank | State | Gallons of Ethanol Per Capita* |
|---|---|---|
| 1 | New Hampshire | 4.20 |
| 2 | Delaware | 4.09 |
| 3 | Washington, D.C. | 3.85 |
| 4 | Nevada | 3.55 |
| 5 | North Dakota | 3.40 |
| 6 | Wisconsin | 3.15 |
| 7 | Montana | 3.12 |
| 8 | Colorado | 3.07 |
| 9 | California | 2.98 |
| 10 | Vermont | 2.96 |
| 11 | Florida | 2.94 |
| 12 | Oregon | 2.88 |
| 13 | Massachusetts | 2.87 |
| 14 | Minnesota | 2.87 |
| 15 | Alaska | 2.81 |
| 16 | Maine | 2.79 |
| 17 | Wyoming | 2.78 |
| 18 | Missouri | 2.76 |
| 19 | Rhode Island | 2.75 |
| 20 | Louisiana | 2.69 |
| 21 | Hawaii | 2.64 |
| 22 | New Jersey | 2.55 |
| 23 | Pennsylvania | 2.44 |
| 24 | Illinois | 2.39 |
| 25 | Connecticut | 2.37 |
| 26 | Tennessee | 2.36 |
| 27 | Texas | 2.34 |
| 28 | Iowa | 2.33 |
| 29 | Arizona | 2.32 |
| 30 | New Mexico | 2.31 |
| 31 | Michigan | 2.30 |
| 32 | North Carolina | 2.28 |
| 33 | New York | 2.24 |
| 34 | Indiana | 2.23 |
| 35 | Maryland | 2.18 |
| 36 | Washington | 2.17 |
| 37 | Mississippi | 2.16 |
| 38 | South Dakota | 2.16 |
| 39 | Kentucky | 2.14 |
| 40 | Kansas | 2.13 |
| 41 | Virginia | 2.12 |
| 42 | Nebraska | 2.07 |
| 43 | Ohio | 2.03 |
| 44 | South Carolina | 2.03 |
| 45 | Georgia | 1.96 |
| 46 | Alabama | 1.95 |
| 47 | Arkansas | 1.87 |
| 48 | Idaho | 1.82 |
| 49 | Oklahoma | 1.80 |
| 50 | West Virginia | 1.71 |
| 51 | Utah | 1.21 |
Gallons Overall
| Rank | State | Gallons Overall* |
|---|---|---|
| 1 | California | 96.9M |
| 2 | Texas | 57.9M |
| 3 | Florida | 56.6M |
| 4 | New York | 37.0M |
| 5 | Pennsylvania | 26.7M |
| 6 | Illinois | 25.1M |
| 7 | North Carolina | 20.6M |
| 8 | Ohio | 19.9M |
| 9 | New Jersey | 19.8M |
| 10 | Michigan | 19.4M |
| 11 | Georgia | 17.9M |
| 12 | Massachusetts | 17.1M |
| 13 | Wisconsin | 15.6M |
| 14 | Virginia | 15.4M |
| 15 | Colorado | 15.2M |
| 16 | Arizona | 14.4M |
| 17 | Missouri | 14.2M |
| 18 | Washington | 14.2M |
| 19 | Tennessee | 13.9M |
| 20 | Minnesota | 13.6M |
| 21 | Indiana | 12.6M |
| 22 | Maryland | 11.2M |
| 23 | Oregon | 10.4M |
| 24 | Louisiana | 10.1M |
| 25 | Nevada | 9.5M |
| 26 | South Carolina | 9.1M |
| 27 | Alabama | 8.2M |
| 28 | Kentucky | 8.0M |
| 29 | Connecticut | 7.3M |
| 30 | Iowa | 6.1M |
| 31 | Oklahoma | 5.9M |
| 32 | Mississippi | 5.2M |
| 33 | Kansas | 5.1M |
| 34 | New Hampshire | 5.0M |
| 35 | Arkansas | 4.7M |
| 36 | New Mexico | 4.1M |
| 37 | Delaware | 3.5M |
| 38 | Maine | 3.3M |
| 39 | Nebraska | 3.3M |
| 40 | Utah | 3.3M |
| 41 | Hawaii | 3.1M |
| 42 | Idaho | 2.9M |
| 43 | Montana | 2.9M |
| 44 | Rhode Island | 2.5M |
| 45 | West Virginia | 2.5M |
| 46 | Washington, D.C. | 2.2M |
| 47 | North Dakota | 2.1M |
| 48 | Alaska | 1.6M |
| 49 | South Dakota | 1.6M |
| 50 | Vermont | 1.6M |
| 51 | Wyoming | 1.3M |
*Image retrieved from No Revisions – unsplash.com