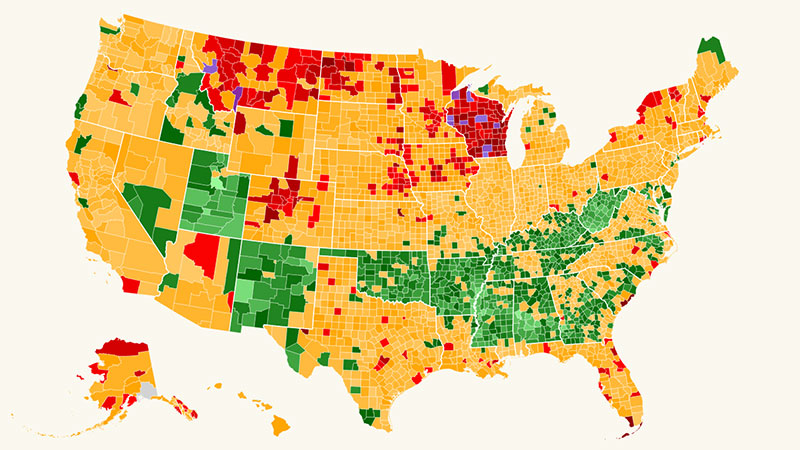
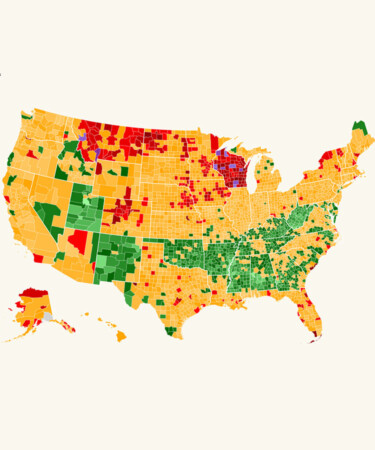
America’s drinking culture is extremely diverse, which makes it all the more fascinating to dissect. While we’ve covered the states that drink the most in the U.S. before, this new interactive map from IntoxiStates breaks down America’s consumption data on a county-by-county basis.
The site generated this map using data from the Centers for Disease Control and Prevention’s (CDC) excessive drinking data from county health rankings and roadmaps. The darker red and purple shades represent counties with a higher percentage of excess drinking, which is defined by the CDC as more than eight or 15 drinks per week for women and men respectively.
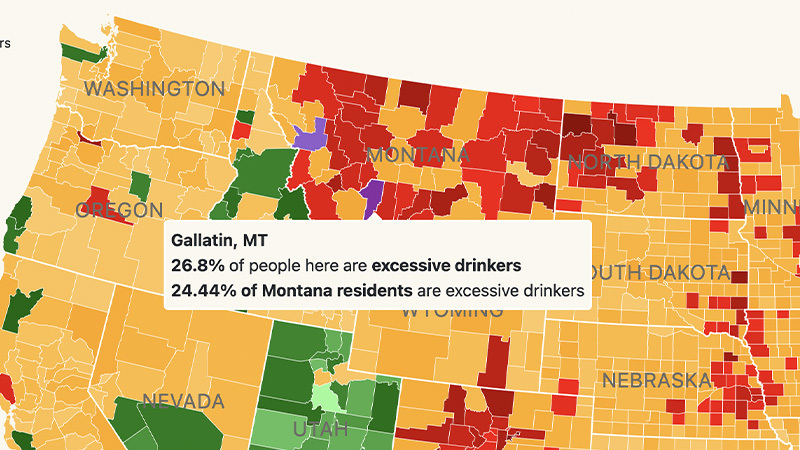
What are the booziest counties in America? The data suggests that Gallatin County, Montana tops the list, where over a quarter (26.8 percent) of residents are considered excessive drinkers. Not far behind is Outagamie, Wisconsin with an excessive drinking population of 26.13 percent.
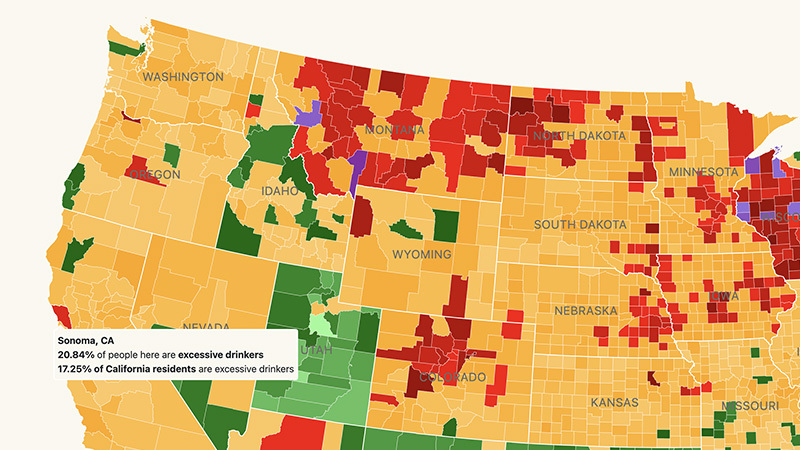
While California as a whole put up moderate numbers, it’s no surprise that the state’s wine country in Sonoma County has the highest percentage of excess drinkers at 20.84 percent. New York, New York is also a stand-out red dot in a sea of yellow and green on this map with a percentage of 20.72, suggesting it’s one of the booziest counties in the Northeast. We blame all of the incredible Martinis.
The overall driest county is Utah’s eponymous county, Utah, with only 9.04 percent of the population considered as excess drinkers. Greene, Alabama (9.44 percent), Catron, New Mexico (10.24), Phillips, Arkansas (10.36), and McDowell, Virginia (10.38) are also among some of the lowest-ranked counties.
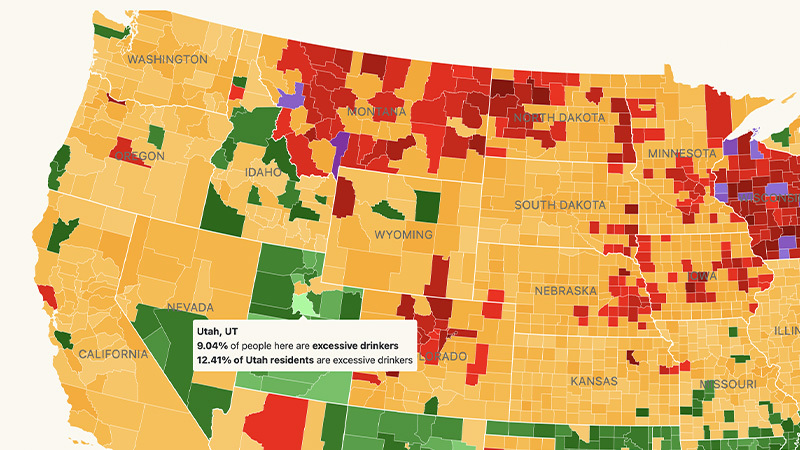
Zooming out, Wisconsin has the highest percentage of excess drinkers on a state-wide basis (25.29 percent), and Utah has the lowest (12.41 percent). And although there are some exceptions, states further north appear to be overall boozier than their neighbors to the south.
Visit this link to see where your county stands amongst the nation’s 3,143.
