![The States With the Most Wineries in 2026 [MAP]](https://vinepair.com/wp-content/uploads/2026/02/wineries-by-state-card-375x450.jpg "The States With the Most Wineries in 2026 [MAP]")
The total number of wineries in the U.S. contracted for the third year in a row, decreasing by 3 percent from 2025, according to the WineBusiness Analytics Winery Database. The downward trend is particularly noticeable in state-by-state counts, where the most populated state, California, dipped by 2 percent.
The top five states remain the same as in 2023, the last year when the overall number of wineries in the U.S. grew, with Oregon, Washington, Texas, and New York joining California as the states with the most. Among them, Oregon is the only one that recorded positive growth, showing a 3 percent increase from 2025 to 2026 as of February.
Beyond Oregon, six other states saw an increase in winery count: Tennessee, Virginia, Kansas, Vermont, West Virginia, and Arkansas. Two to watch are Virginia and Vermont: Each has carved out a niche for itself thanks to early adoption of and success in cultivating hybrid grapes.
Wine Business Daily publishes this list annually. This year’s list isn’t entirely a cause for doom and gloom: The majority of states’ losses are not drastic, as most drops were by 5 percent or less.
With that, here are the 50 states ranked by their number of wineries in 2026.
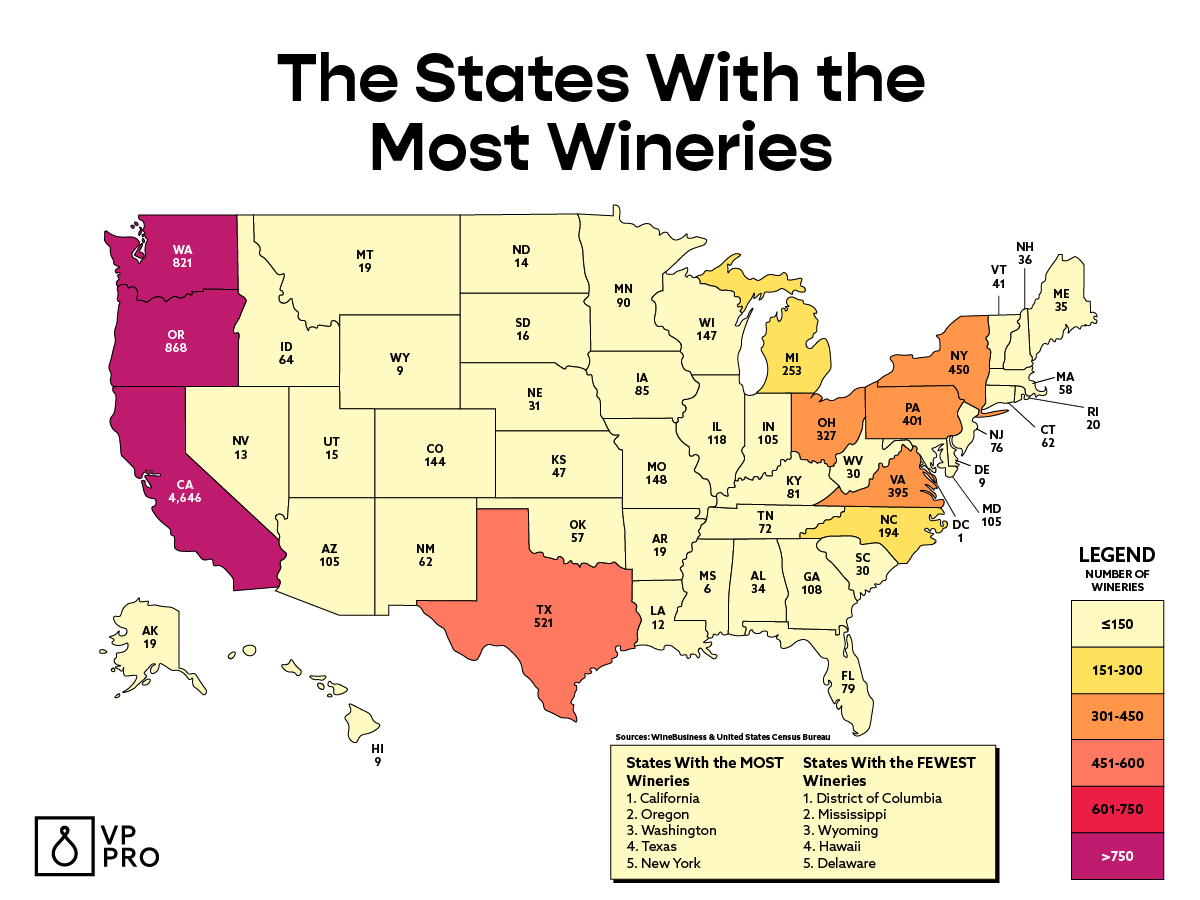
The States With the Most Wineries
| State | Wineries |
| California | 4,646 |
| Oregon | 868 |
| Washington | 821 |
| Texas | 521 |
| New York | 450 |
| Pennsylvania | 401 |
| Virginia | 395 |
| Ohio | 327 |
| Michigan | 253 |
| North Carolina | 194 |
| Missouri | 148 |
| Wisconsin | 147 |
| Colorado | 144 |
| Illinois | 118 |
| Georgia | 108 |
| Arizona | 105 |
| Indiana | 105 |
| Maryland | 105 |
| Minnesota | 90 |
| Iowa | 85 |
| Kentucky | 81 |
| Florida | 79 |
| New Jersey | 76 |
| Tennessee | 72 |
| Idaho | 64 |
| Connecticut | 62 |
| New Mexico | 62 |
| Massachusetts | 58 |
| Oklahoma | 57 |
| Kansas | 47 |
| Vermont | 41 |
| New Hampshire | 36 |
| Maine | 35 |
| Alabama | 34 |
| Nebraska | 31 |
| South Carolina | 30 |
| West Virginia | 30 |
| Rhode Island | 20 |
| Alaska | 19 |
| Arkansas | 19 |
| Montana | 19 |
| South Dakota | 16 |
| Utah | 15 |
| North Dakota | 14 |
| Nevada | 13 |
| Louisiana | 12 |
| Delaware | 9 |
| Hawaii | 9 |
| Wyoming | 9 |
| Mississippi | 6 |
| Washington, D.C. | 1 |
| Total | 11,107 |
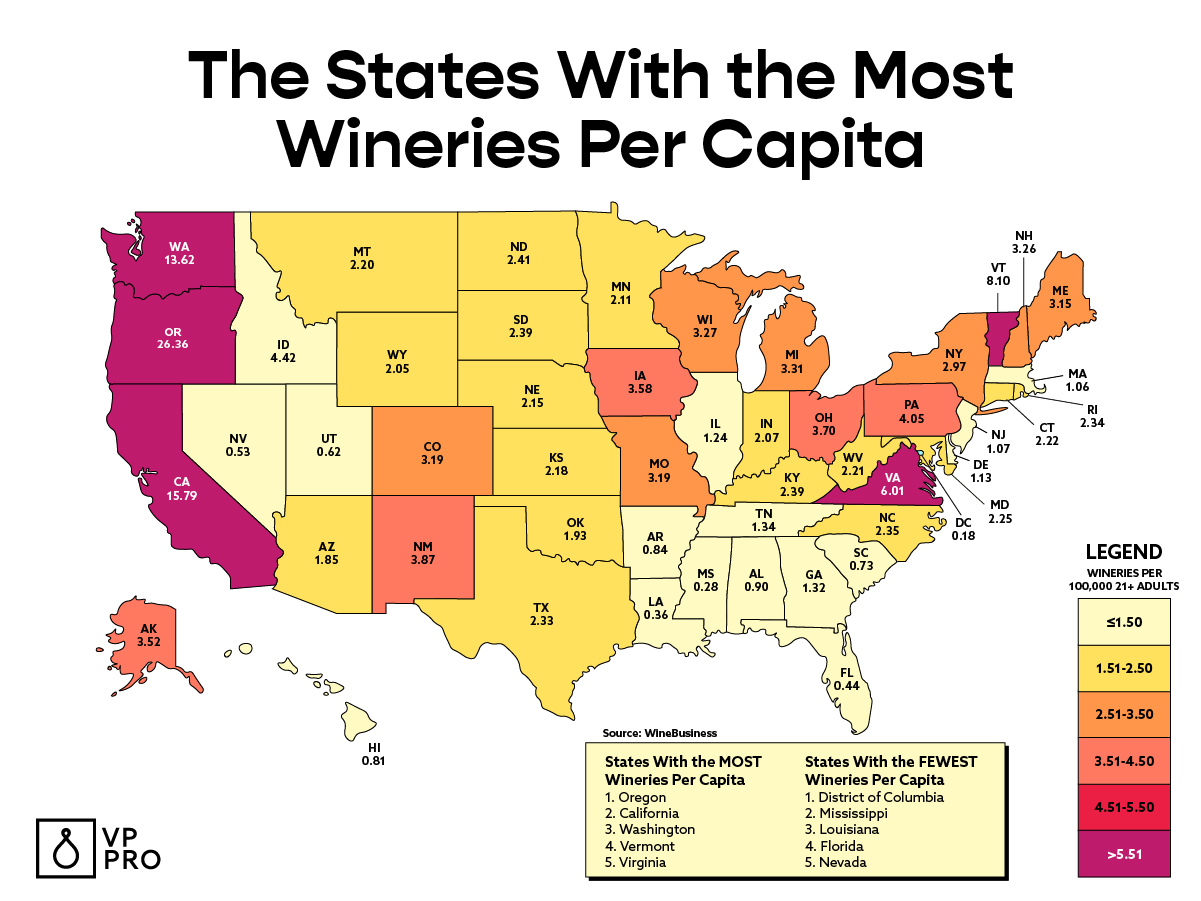
The States With the Most Wineries Per Capita (Per 100,000 Residents)
| State | Wineries Per Capita |
| Oregon | 26.36 |
| California | 15.79 |
| Washington | 13.62 |
| Vermont | 8.10 |
| Virginia | 6.01 |
| Idaho | 4.42 |
| Pennsylvania | 4.05 |
| New Mexico | 3.87 |
| Ohio | 3.70 |
| Iowa | 3.58 |
| Alaska | 3.52 |
| Michigan | 3.31 |
| Wisconsin | 3.27 |
| New Hampshire | 3.26 |
| Missouri | 3.19 |
| Colorado | 3.19 |
| Maine | 3.15 |
| New York | 2.97 |
| North Dakota | 2.41 |
| Kentucky | 2.39 |
| South Dakota | 2.39 |
| North Carolina | 2.35 |
| Rhode Island | 2.34 |
| Texas | 2.33 |
| Maryland | 2.25 |
| Connecticut | 2.22 |
| West Virginia | 2.21 |
| Montana | 2.20 |
| Kansas | 2.18 |
| Nebraska | 2.15 |
| Minnesota | 2.11 |
| Indiana | 2.07 |
| Wyoming | 2.05 |
| Oklahoma | 1.93 |
| Arizona | 1.85 |
| Tennessee | 1.34 |
| Georgia | 1.32 |
| Illinois | 1.24 |
| Delaware | 1.13 |
| New Jersey | 1.07 |
| Massachusetts | 1.06 |
| Alabama | 0.90 |
| Arkansas | 0.84 |
| Hawaii | 0.81 |
| South Carolina | 0.73 |
| Utah | 0.62 |
| Nevada | 0.53 |
| Florida | 0.44 |
| Louisiana | 0.36 |
| Mississippi | 0.28 |
| Washington, D.C. | 0.18 |
| Total | 4.38 |
*Image retrieved from bbourdages – stock.adobe.com
This story is a part of VP Pro, our free platform and newsletter for drinks industry professionals, covering wine, beer, liquor, and beyond. Sign up for VP Pro now!