![The States That Drink the Most Alcohol in America (2022) [Map]](https://vinepair.com/wp-content/uploads/2023/01/states-that-drink-the-most-alcohol-in-america-infographic-card-375x450.jpg "The States That Drink the Most Alcohol in America (2022) [Map]")
Americans love their alcohol. According to data published by the National Institute on Alcohol Abuse and Alcoholism, U.S. residents’ consumption of alcoholic beverages has been on a steady incline since 1995, with a whopping 7.9 billion gallons consumed in 2020. That marks a 1 million-plus increase in gallons drunk from the previous year, likely thanks to the onslaught of the Covid-19 pandemic.
Of the 7.9 billion gallons consumed by Americans in 2020, beer was the overwhelming favorite — with an estimated 6.4 billion gallons drunk — followed by wine and spirits, of which Americans enjoyed 931 million and 635 million gallons, respectively. While it’s clear the pandemic had an impact on the volume of alcohol consumed by Americans, it also had an impact on what kinds of alcohol Americans reached for. In 2020, domestic consumption of spirits increased by almost 46 million gallons from 2019. In comparison, wine consumption increased by 22 million gallons, while beer consumption saw little to no change.
When broken down by region, the West Coast takes the crown as the booziest in the United States with an annual per capita consumption of 2.56 gallons. On the other hand, while the South may consume the most alcohol by volume — 245.1 million gallons in 2020 — it is actually the region that drinks the least per capita (2.34 gallons per year). Both the Northeast and the Midwest drink roughly the same amount per capita, drinking 2.48 and 2.49 gallons per year, respectively.
Curious to see how your state stacks up against the rest? Take a peek at our maps below to see just how much Americans drink from state to state.
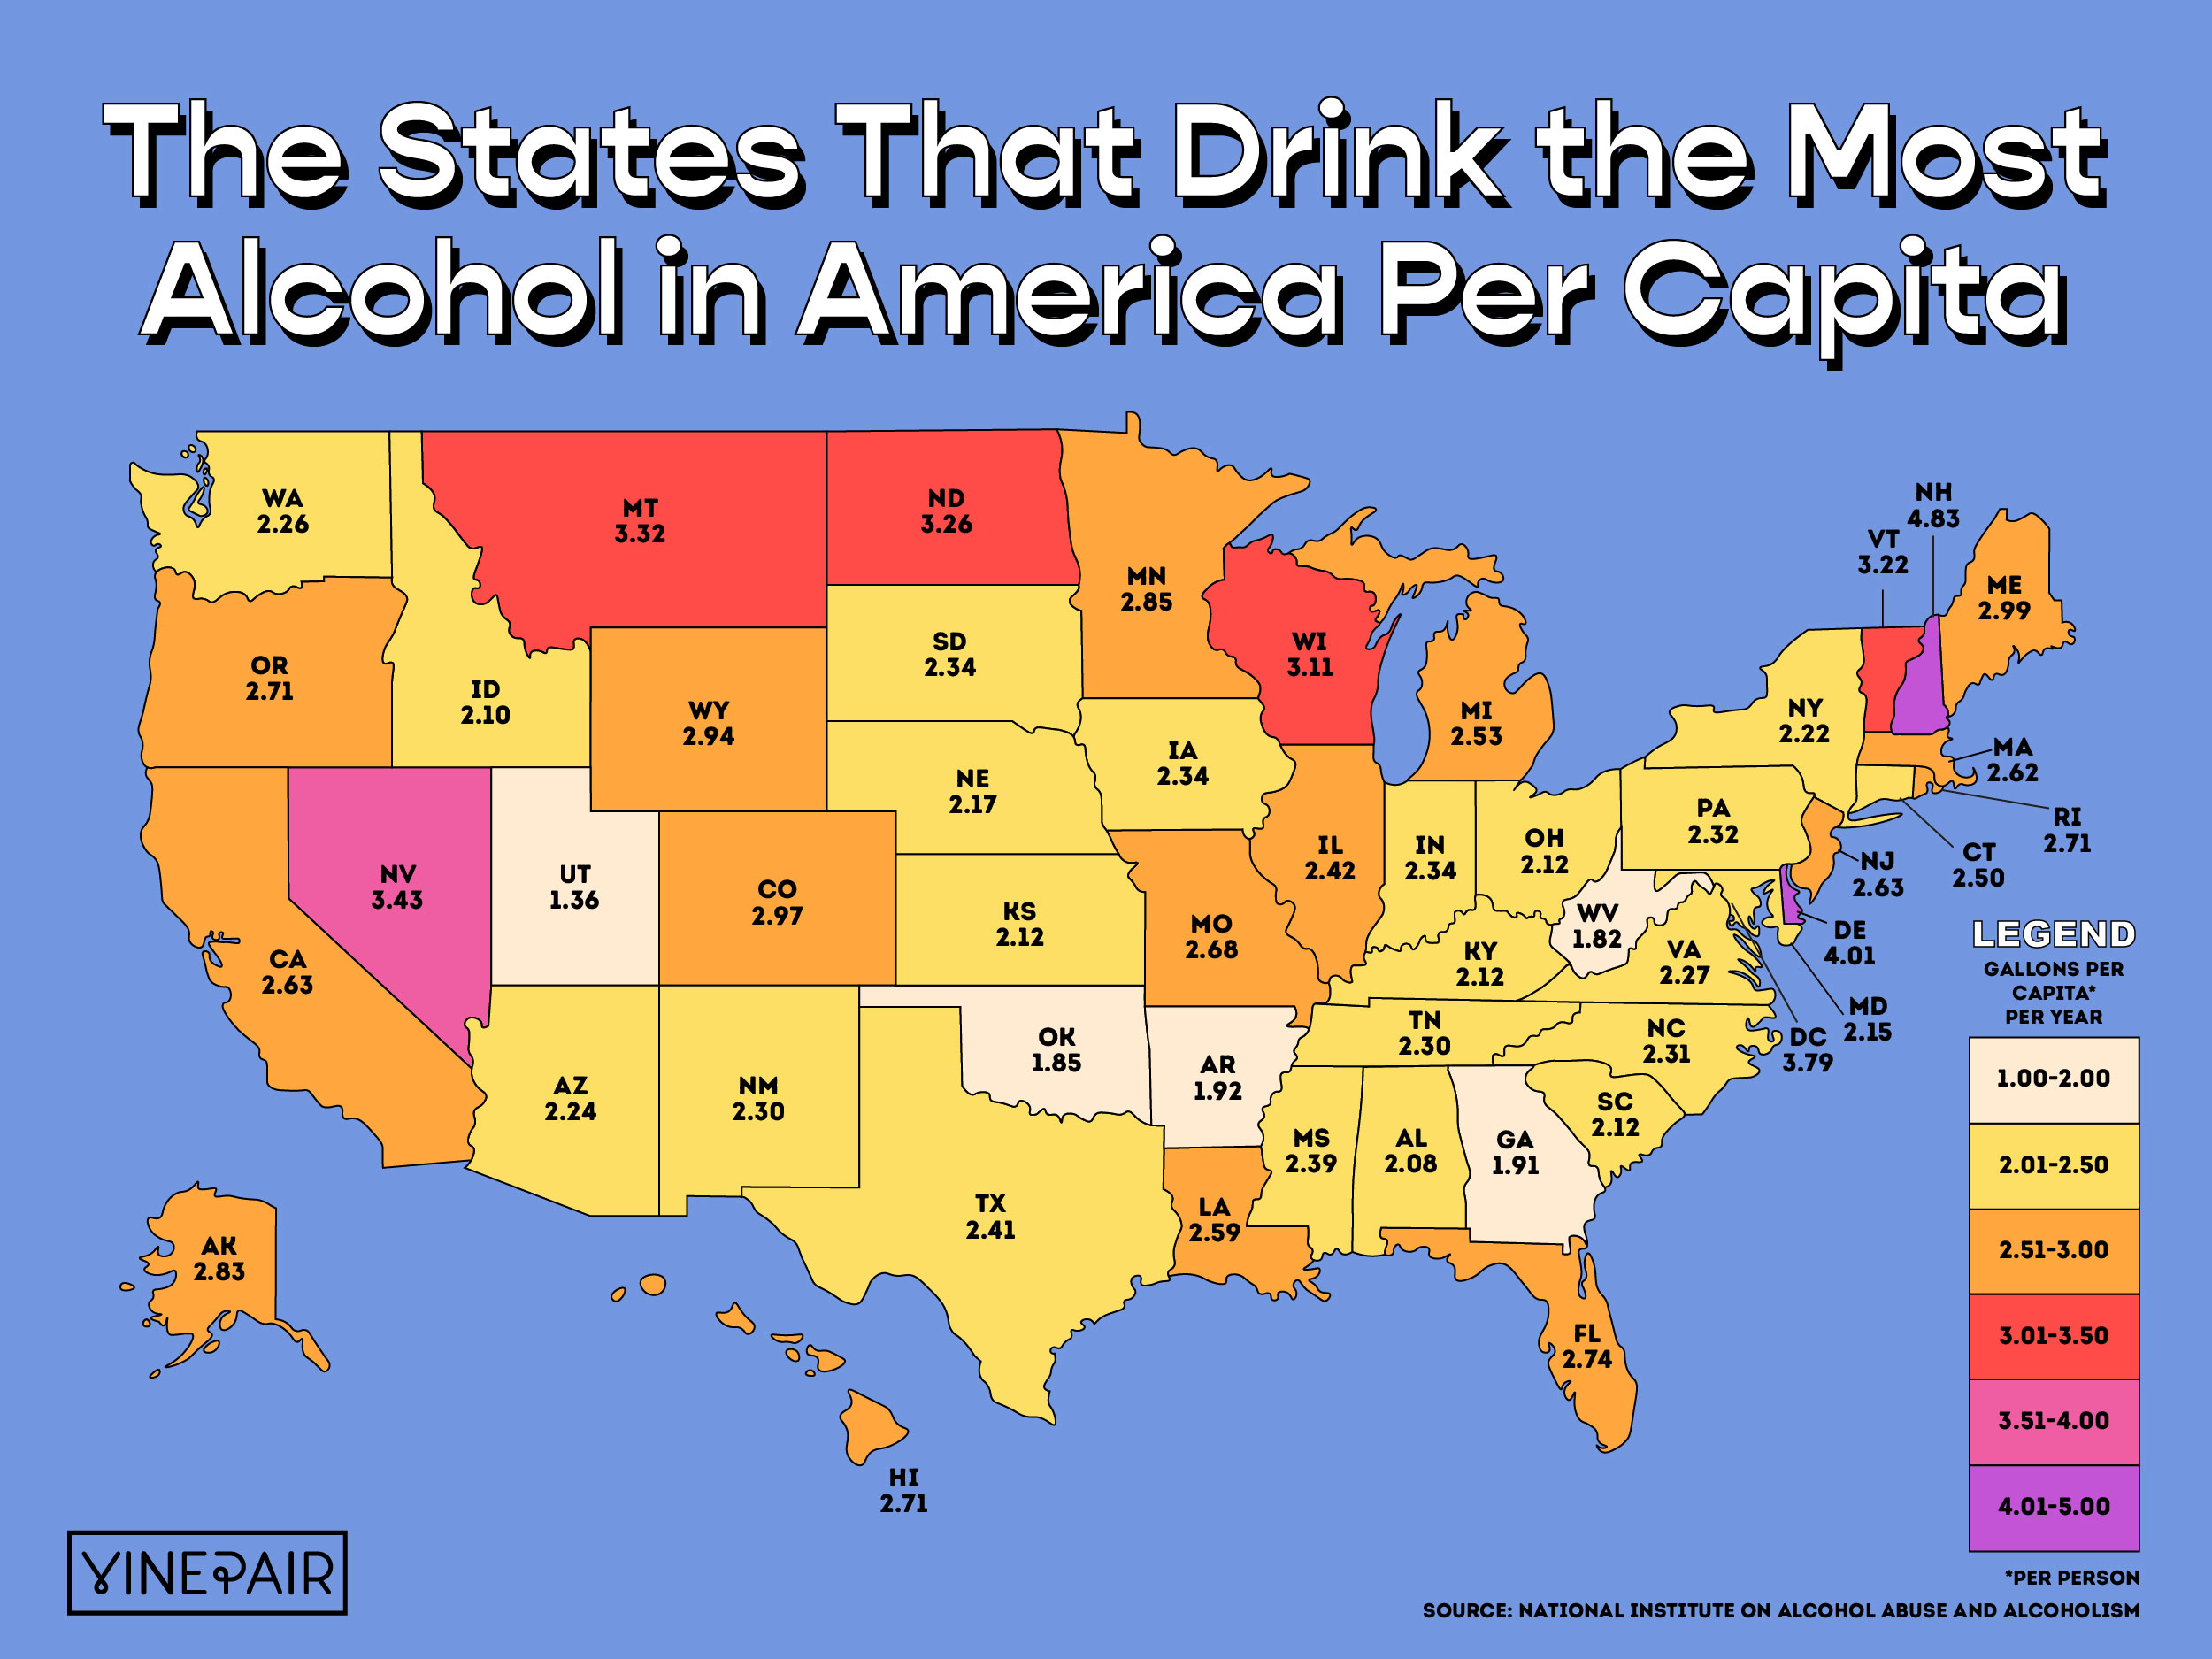
The States That Drink the Most Alcohol Per Capita
Of the 50 states and Washington D.C., New Hampshire reports the most booze drunk per capita, with approximately 4.83 gallons consumed per year. However, it’s important to note that due to the state’s lack of sales tax, a number of these gallons are consumed by folks from neighboring states who cross over into New Hampshire to take advantage of cheaper prices. The small New England state also enjoys the most beer and spirits per capita, while Washington, D.C., consumes the most wine. Predictably, Utah — the state with the strictest booze laws in America — consumes the least amount of alcohol per capita (1.36 gallons).
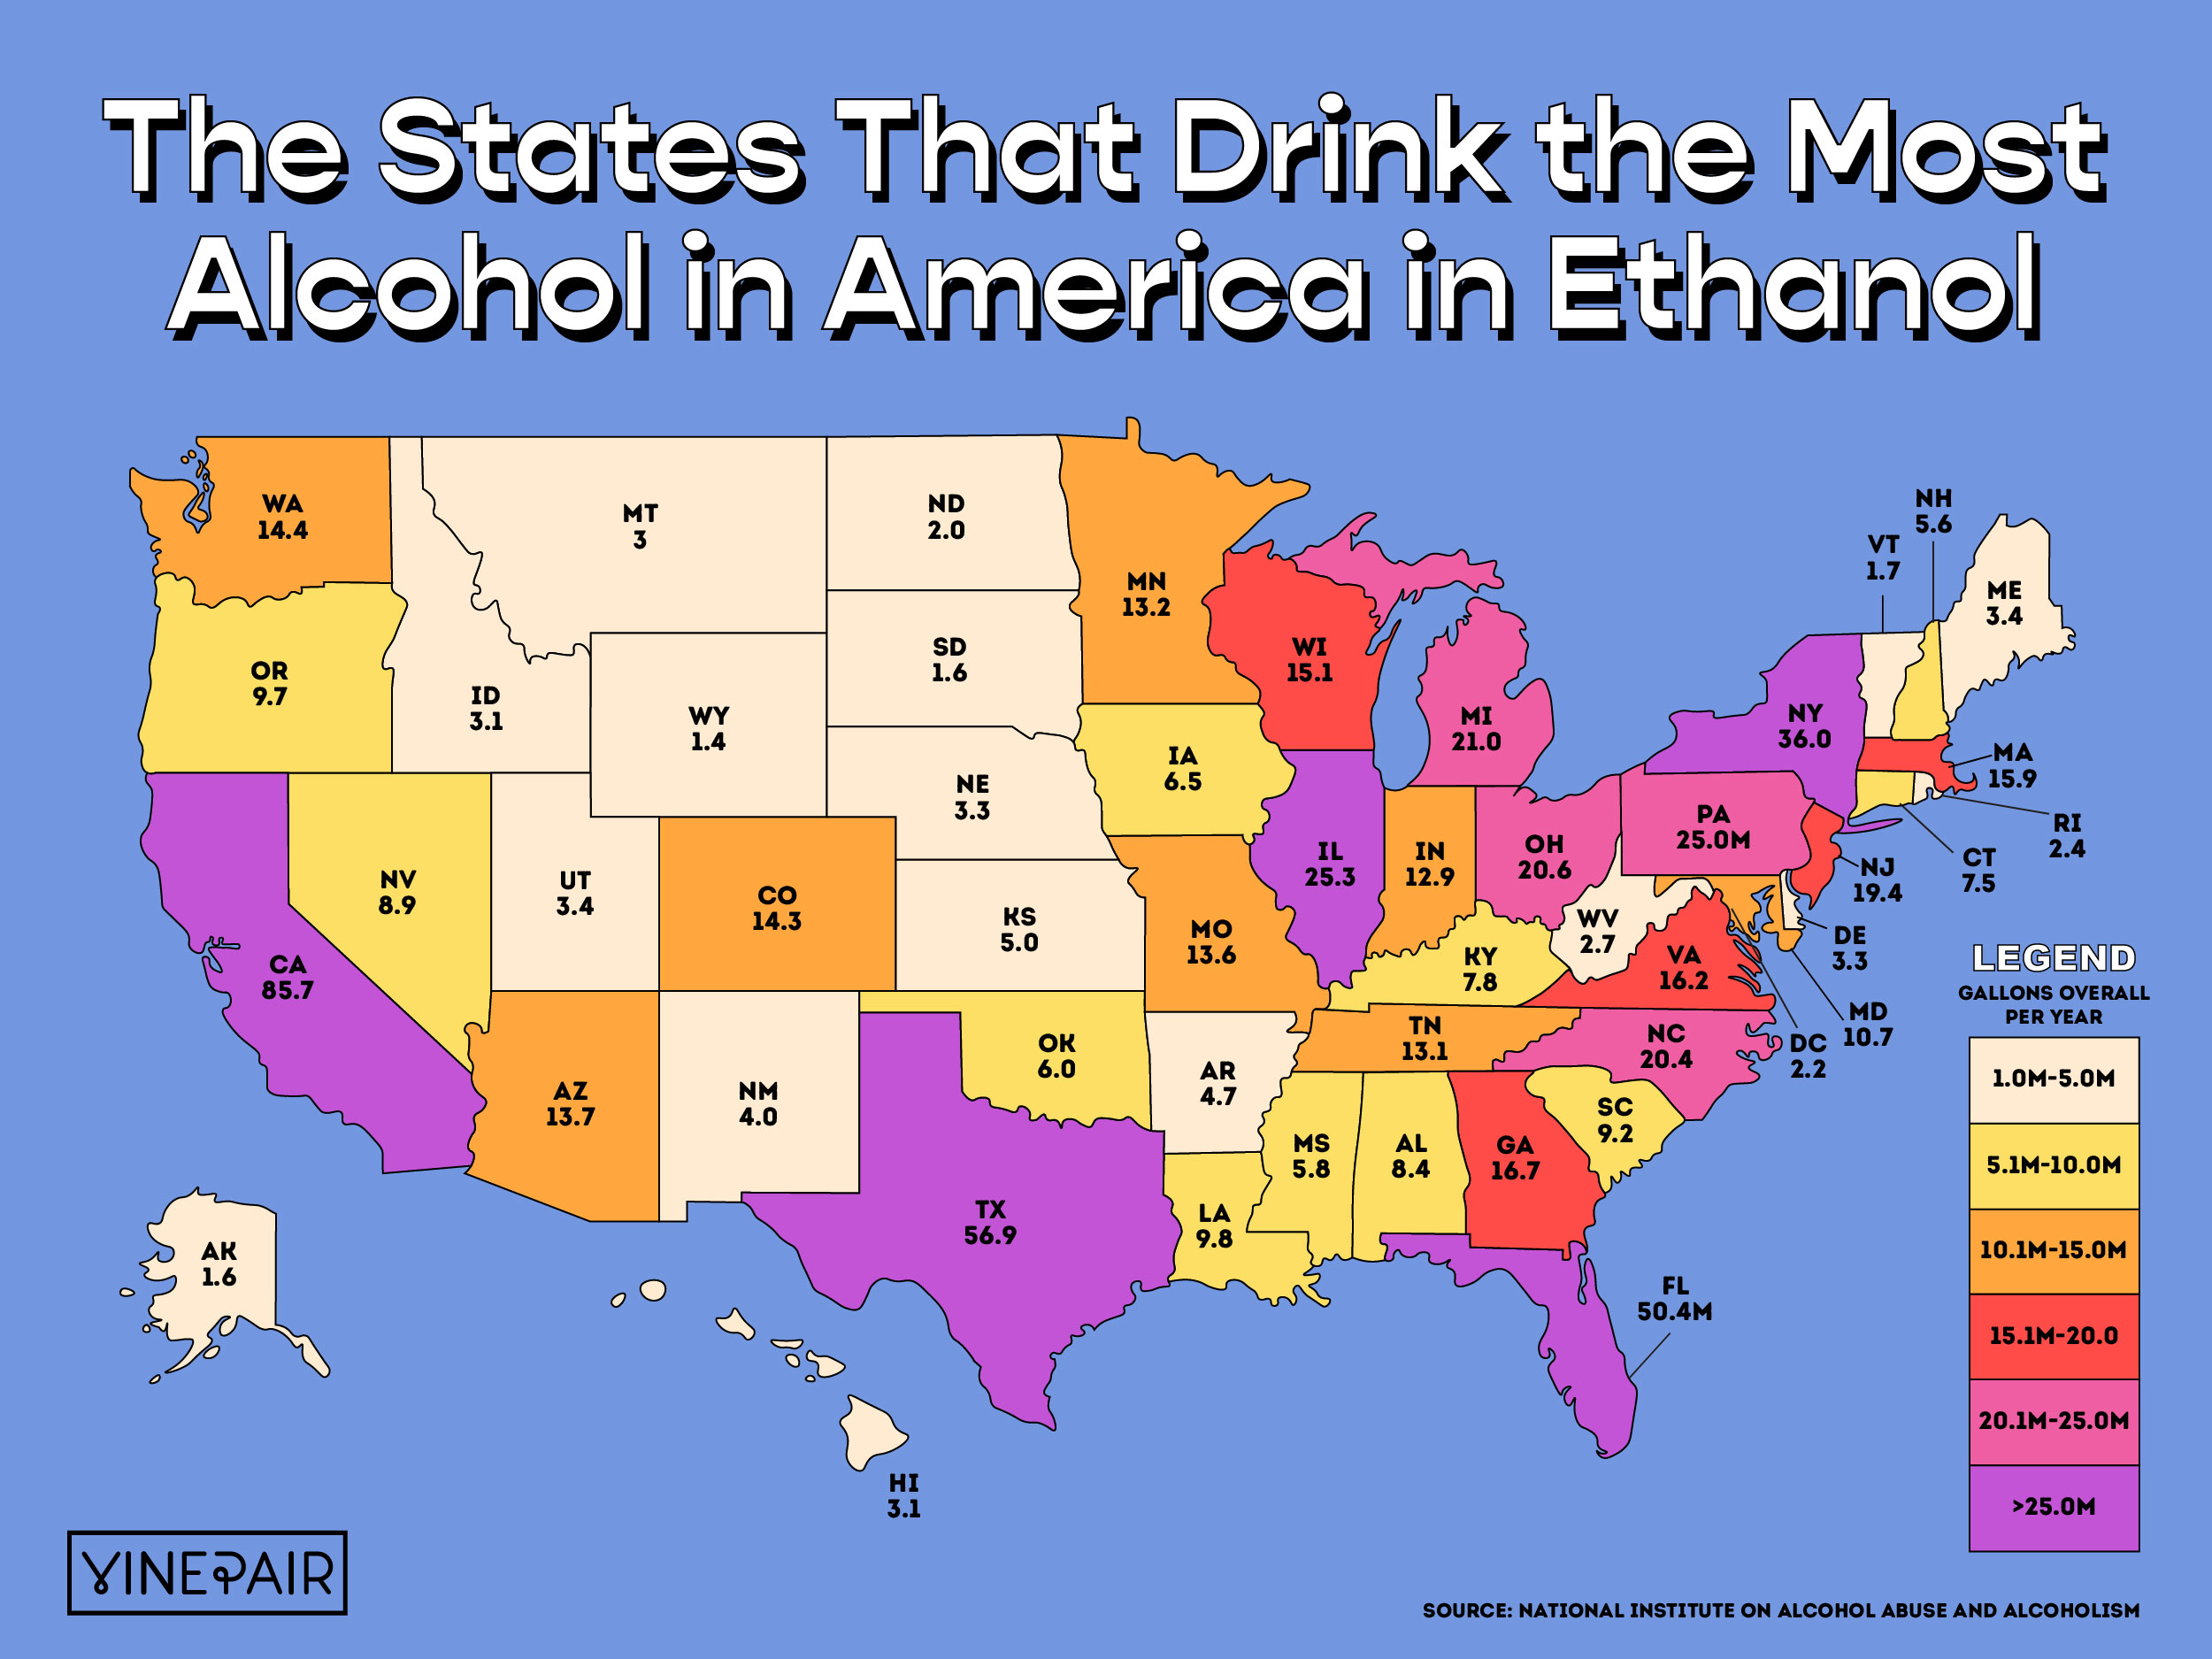
The States That Drink the Most Alcohol in Ethanol
Unsurprisingly, the most densely populated states in the U.S. consume the most alcohol by volume. California leads the pack with 85.7 million gallons consumed in 2020. Texas, Florida, New York, and Illinois round out the remainder of the top five. Conversely, Wyoming, Alaska, and South Dakota consume the least.
Ranking the States
Gallons Per Capita
| Rank | State | Gallons of Ethanol Per Capita* |
|---|---|---|
| 1 | New Hampshire | 4.83 |
| 2 | Delaware | 4.01 |
| 3 | Washington D.C. | 3.79 |
| 4 | Nevada | 3.43 |
| 5 | Montana | 3.32 |
| 6 | North Dakota | 3.26 |
| 7 | Vermont | 3.22 |
| 8 | Wisconsin | 3.11 |
| 9 | Maine | 2.99 |
| 10 | Colorado | 2.97 |
| 11 | Wyoming | 2.94 |
| 12 | Minnesota | 2.85 |
| 13 | Alaska | 2.83 |
| 14 | Florida | 2.74 |
| 15 | Hawaii | 2.71 |
| 16 | Oregon | 2.71 |
| 17 | Rhode Island | 2.71 |
| 18 | Missouri | 2.68 |
| 19 | California | 2.63 |
| 20 | New Jersey | 2.63 |
| 21 | Massachusetts | 2.62 |
| 22 | Louisiana | 2.59 |
| 23 | Michigan | 2.53 |
| 24 | Connecticut | 2.50 |
| 25 | Illinois | 2.42 |
| 26 | Texas | 2.41 |
| 27 | Mississippi | 2.39 |
| 28 | Indiana | 2.34 |
| 29 | Iowa | 2.34 |
| 30 | South Dakota | 2.34 |
| 31 | Pennsylvania | 2.32 |
| 32 | North Carolina | 2.31 |
| 33 | New Mexico | 2.30 |
| 34 | Tennessee | 2.30 |
| 35 | Virginia | 2.27 |
| 36 | Washington | 2.26 |
| 37 | Arizona | 2.24 |
| 38 | New York | 2.22 |
| 39 | Nebraska | 2.17 |
| 40 | Maryland | 2.15 |
| 41 | Kansas | 2.12 |
| 42 | Kentucky | 2.12 |
| 43 | Ohio | 2.12 |
| 44 | South Carolina | 2.12 |
| 45 | Idaho | 2.10 |
| 46 | Alabama | 2.08 |
| 47 | Arkansas | 1.92 |
| 48 | Georgia | 1.91 |
| 49 | Oklahoma | 1.85 |
| 50 | West Virginia | 1.82 |
| 51 | Utah | 1.36 |
Gallons Overall
| Rank | State | Gallons Overall* |
|---|---|---|
| 1 | California | 85.7M |
| 2 | Texas | 56.9M |
| 3 | Florida | 50.4M |
| 4 | New York | 36M |
| 5 | Illinois | 25.3M |
| 6 | Pennsylvania | 25M |
| 7 | Michigan | 21M |
| 8 | Ohio | 20.6M |
| 9 | North Carolina | 20.4M |
| 10 | New Jersey | 19.4M |
| 11 | Georgia | 16.7M |
| 12 | Virginia | 16.2M |
| 13 | Massachusetts | 15.9M |
| 14 | Wisconsin | 15.1M |
| 15 | Washington | 14.4M |
| 16 | Colorado | 14.3M |
| 17 | Arizona | 13.7M |
| 18 | Missouri | 13.6M |
| 19 | Minnesota | 13.2M |
| 20 | Tennessee | 13.1M |
| 21 | Indiana | 12.9M |
| 22 | Maryland | 10.7M |
| 23 | Louisiana | 9.8M |
| 24 | Oregon | 9.6M |
| 25 | South Carolina | 9.2M |
| 26 | Nevada | 8.9M |
| 27 | Alabama | 8.4M |
| 28 | Kentucky | 7.8M |
| 29 | Connecticut | 7.5M |
| 30 | Iowa | 6.5M |
| 31 | Oklahoma | 6M |
| 32 | Mississippi | 5.8M |
| 33 | New Hampshire | 5.6M |
| 34 | Kansas | 5M |
| 35 | Arkansas | 4.7M |
| 36 | New Mexico | 4M |
| 37 | Maine | 3.4M |
| 38 | Utah | 3.4M |
| 39 | Nebraska | 3.3M |
| 40 | Delaware | 3.3M |
| 41 | Hawaii | 3.1M |
| 42 | Idaho | 3.1M |
| 43 | Montana | 3M |
| 44 | West Virginia | 2.7M |
| 45 | Rhode Island | 2.4M |
| 46 | Washington D.C. | 2.2M |
| 47 | North Dakota | 2M |
| 48 | Vermont | 1.7M |
| 49 | South Dakota | 1.6M |
| 50 | Alaska | 1.6M |
| 51 | Wyoming | 1.4M |
*This data uses an estimate of average ethanol content of sold or shipped spirits into gallons of ethanol (pure alcohol) before calculating per capita consumption estimates. For this data, the alcohol by volume value is 0.129 for wine, 0.045 for beer, and 0.411 for spirits.
*Photo sourced from romanovad – stock.adobe.com