![The States That Drink the Most Alcohol in America [Map]](https://vinepair.com/wp-content/uploads/2020/06/map_alc_card-375x450.jpg "The States That Drink the Most Alcohol in America [Map]")
America loves to drink. According to a report from the National Institute on Alcohol Abuse and Alcoholism, Americans’ alcohol consumption reached 7.8 billion gallons in 2018. U.S. residents reportedly drank 6.3 billion gallons of beer, 900 million gallons of wine, and 570 million gallons of spirits. As a country, we drink an average of 2.35 gallons of alcohol per capita per year — which amounts to about 501 standard drinks annually.
As do many cultural habits, alcohol consumption varies by state and region: The West drinks by far the most booze of any region, coming in at 2.5 gallons per capita, while the South drinks the least, consuming a mere 2.23 gallons per person per year. The Northeast and Midwest drink 2.41 and 3.27 gallons per capita, respectively.
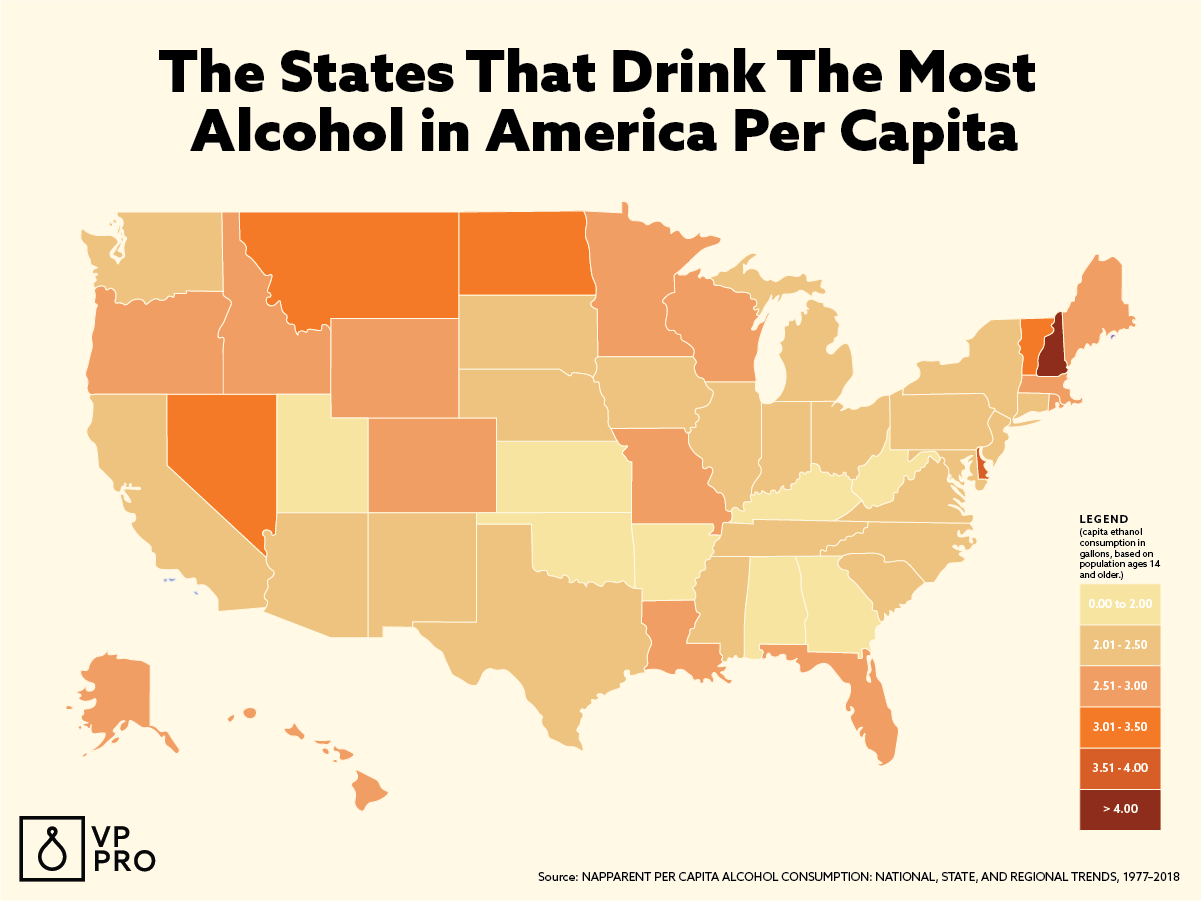
Wondering how your home state stacks up against its neighbors? Take a look at our color-coded map to see how much alcohol the residents of each U.S. state and Washington, D.C., drink each year.
THE STATES THAT DRINK THE MOST ALCOHOL PER CAPITA
When it comes to the states that drink the most booze per capita, the tiny state of New Hampshire looms largest. The Northeastern state comes in first for both beer and spirit consumption, likely due to its negligible booze tax. Utah drinks the least booze — an unsurprising fact, as the state has the strictest booze laws in America.
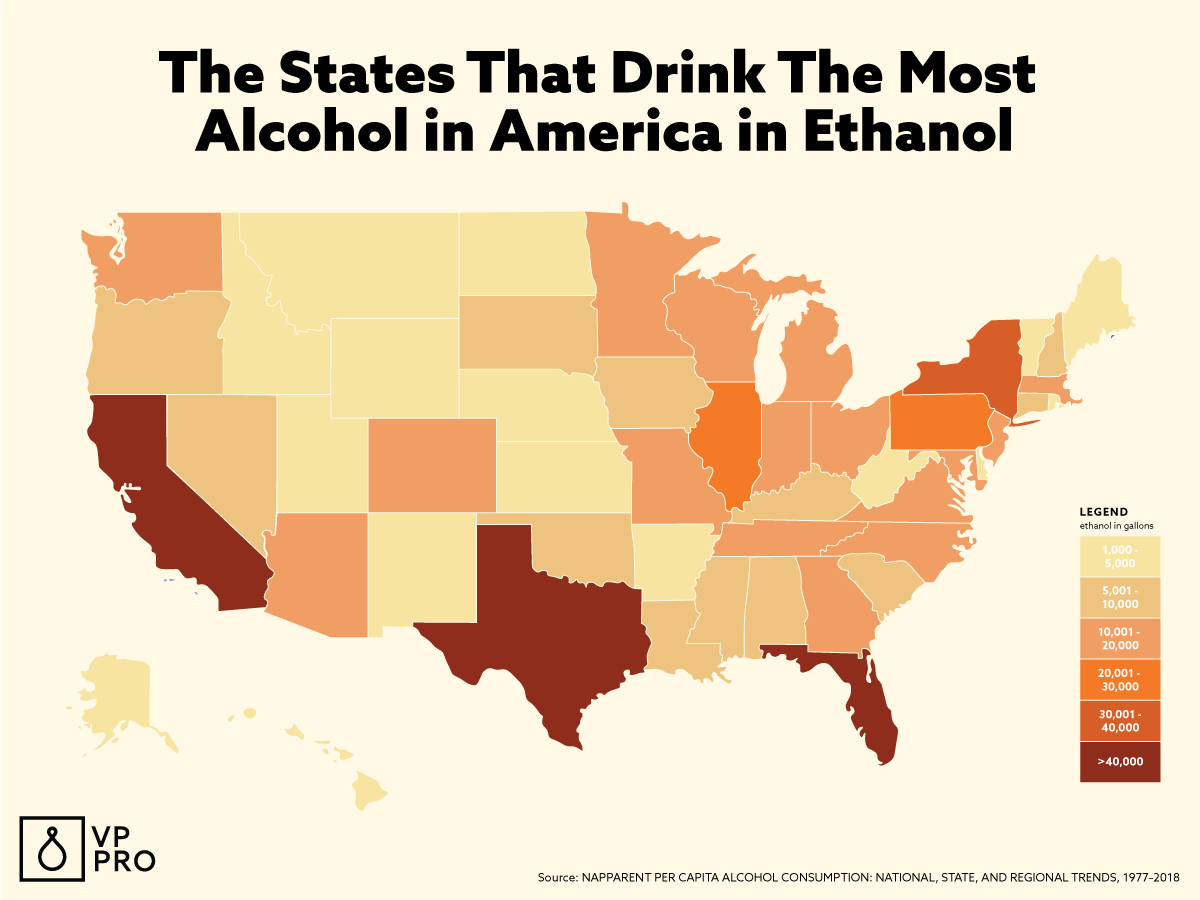
THE STATES THAT DRINK THE MOST ALCOHOL IN ETHANOL
The highly populated states of California, Texas, Florida, and New York led this category. Residents of Wyoming, South Dakota, Vermont, and Alaska, on the other hand, stayed relatively clear of the hard stuff.
RANKING THE STATES
Gallons Per Capita
| Rank | State | Gallons of Ethanol Per Capita* |
|---|---|---|
| 1 | New Hampshire | 4.67 |
| 2 | Washington, D.C. | 3.77 |
| 3 | Delaware | 3.52 |
| 4 | Nevada | 3.42 |
| 5 | North Dakota | 3.16 |
| 6 | Montana | 3.10 |
| 7 | Vermont | 3.06 |
| 8 | Idaho | 2.94 |
| 9 | Wisconsin | 2.93 |
| 10 | Colorado | 2.88 |
| 11 | Alaska | 2.85 |
| 11 | Maine | 2.85 |
| 13 | Minnesota | 2.79 |
| 14 | Wyoming | 2.78 |
| 15 | Oregon | 2.74 |
| 16 | Hawaii | 2.66 |
| 17 | Rhode Island | 2.63 |
| 18 | Florida | 2.61 |
| 19 | Massachusetts | 2.55 |
| 19 | Louisiana | 2.55 |
| 21 | Missouri | 2.51 |
| 22 | California | 2.49 |
| 23 | Connecticut | 2.40 |
| 24 | Iowa | 2.39 |
| 24 | Illinois | 2.39 |
| 26 | South Dakota | 2.37 |
| 27 | New Jersey | 2.36 |
| 27 | Michigan | 2.36 |
| 29 | Pennsylvania | 2.34 |
| 30 | New Mexico | 2.26 |
| 30 | Texas | 2.26 |
| 32 | Arizona | 2.25 |
| 33 | Washington | 2.22 |
| 34 | New York | 2.21 |
| 35 | North Carolina | 2.17 |
| 35 | Mississippi | 2.17 |
| 37 | South Carolina | 2.16 |
| 37 | Nebraska | 2.16 |
| 39 | Indiana | 2.15 |
| 40 | Tennessee | 2.14 |
| 41 | Virginia | 2.13 |
| 42 | Maryland | 2.08 |
| 43 | Ohio | 2.03 |
| 44 | Alabama | 1.99 |
| 45 | Kentucky | 1.95 |
| 46 | Kansas | 1.92 |
| 47 | Georgia | 1.90 |
| 48 | Oklahoma | 1.85 |
| 49 | Arkansas | 1.78 |
| 50 | West Virginia | 1.74 |
| 51 | Utah | 1.35 |
Gallons Overall
| Rank | State | Gallons Overall* |
|---|---|---|
| 1 | California | 81.2M |
| 2 | Texas | 51.8M |
| 3 | Florida | 47M |
| 4 | New York | 36.3M |
| 5 | Illinois | 25.2M |
| 5 | Pennsylvania | 25.2M |
| 7 | Michigan | 19.7M |
| 7 | Ohio | 19.7M |
| 9 | North Carolina | 18.7M |
| 10 | New Jersey | 17.5M |
| 11 | Georgia | 16.4M |
| 12 | Virginia | 15.1M |
| 13 | Massachusetts | 15M |
| 14 | Wisconsin | 14.2M |
| 15 | Washington | 13.9M |
| 16 | Colorado | 13.6M |
| 17 | Arizona | 13.3M |
| 18 | Minnesota | 12.8M |
| 19 | Missouri | 12.7M |
| 20 | Tennessee | 12M |
| 21 | Indiana | 11.8M |
| 22 | Maryland | 10.4M |
| 23 | Louisiana | 9.7M |
| 24 | Oregon | 9.6M |
| 25 | South Carolina | 9.1M |
| 26 | Nevada | 8.5M |
| 27 | Alabama | 8M |
| 27 | Connecticut | 7.3M |
| 29 | Kentucky | 7.2M |
| 30 | Iowa | 6.2M |
| 31 | Oklahoma | 5.9M |
| 32 | New Hampshire | 5.4M |
| 33 | Mississippi | 5.3M |
| 34 | Kansas | 4.5M |
| 35 | Arkansas | 4.4M |
| 36 | Idaho | 4.1M |
| 37 | New Mexico | 3.9M |
| 38 | Nebraska | 3.4M |
| 39 | Maine | 3.3M |
| 39 | Utah | 3.3M |
| 41 | Hawaii | 3.1M |
| 42 | Delaware | 2.9M |
| 43 | Montana | 2.7M |
| 43 | West Virginia | 2.7M |
| 45 | Rhode Island | 2.4M |
| 46 | Washington, D.C. | 2.3M |
| 47 | North Dakota | 2M |
| 48 | Alaska | 1.7M |
| 48 | Vermont | 1.7M |
| 48 | South Dakota | 1.7M |
| 51 | Wyoming | 1.3M |
*This data uses an estimate of average ethanol content of sold or shipped spirits into gallons of ethanol (pure alcohol) before calculating per capita consumption estimates. For this data, the alcohol by volume value is 0.129 for wine, 0.045 for beer, and 0.411 for spirits.