Across the board, Americans are big supporters of booze. In fact, we drink about 570 million gallons of liquor each year — and that’s not to mention 914 million gallons of wine, and over 6 billion gallons of beer.
But according to recent data from the National Institute on Alcohol Abuse and Alcoholism, certain states are drinking more spirits than others.
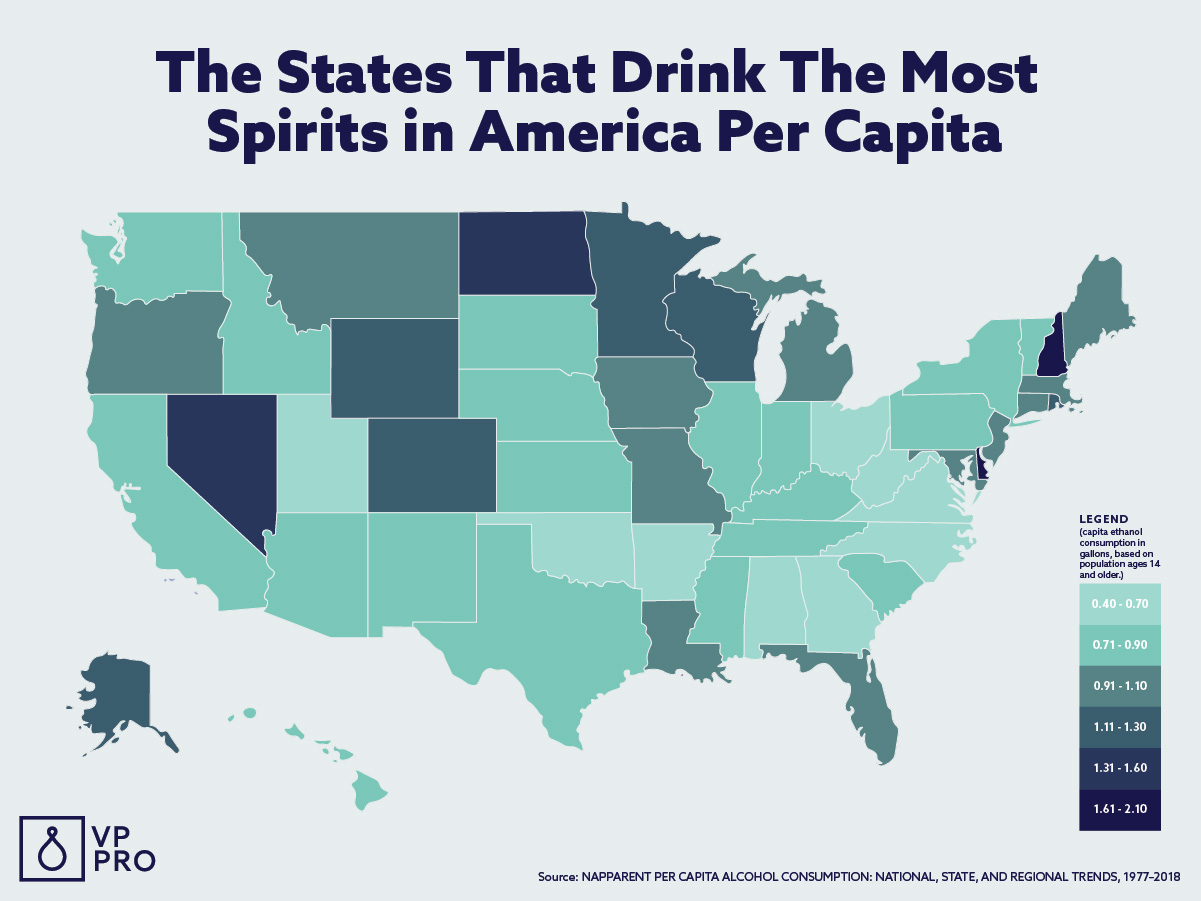
When it comes to residents drinking the most liquor per capita, New Hampshire tops the list — likely due to its low tax on booze — followed by Delaware, the District of Columbia, and Nevada — the latter likely thanks to tourism at the state’s casinos. West Virginians, Utahans, and Ohioans, however, tend to steer clear of the hard stuff more than other American drinkers.
Wondering how boozy your state is? Read on for VinePair’s color-coded maps showing spirits consumption per capita and by volume in the 50 states and Washington, D.C.
THE STATES THAT DRINK THE MOST SPIRITS PER CAPITA
Residents of New Hampshire, Delaware, Washington, D.C., and Nevada drink the highest amount of spirits per capita. On the other end, residents of West Virginia, Utah, and Ohio drink the least.

THE STATES THAT DRINK THE MOST SPIRITS BY VOLUME
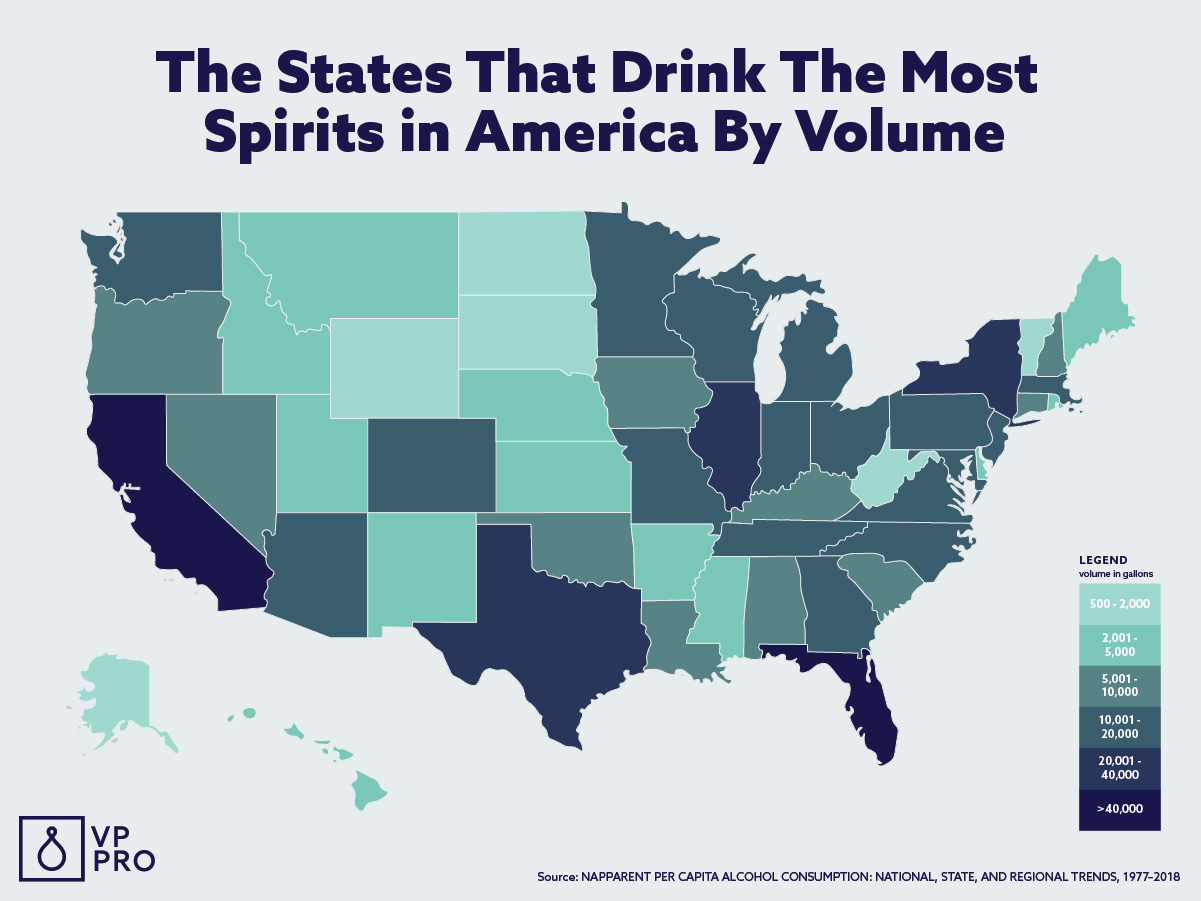
As is true with wine and beer, the highly populated states of California, Florida, Texas, and New York drink the largest quantities of spirits by volume. Vermont drinks the smallest quantity of liquor, consuming less than a million gallons per year — a measly portion compared to California’s yearly 69.1 million gallons.

RANKING THE STATES
Gallons Per Capita
| Rank | State | Gallons of Ethanol Per Capita* |
|---|---|---|
| 1 | New Hampshire | 2.04 |
| 2 | Delaware | 1.69 |
| 3 | Washington, D.C. | 1.68 |
| 4 | Nevada | 1.46 |
| 5 | North Dakota | 1.33 |
| 6 | Alaska | 1.25 |
| 6 | Wisconsin | 1.25 |
| 8 | Wyoming | 1.24 |
| 9 | Colorado | 1.23 |
| 10 | Minnesota | 1.21 |
| 11 | Rhode Island | 1.15 |
| 12 | Maine | 1.07 |
| 13 | Florida | 1.04 |
| 14 | Missouri | 1.02 |
| 15 | Connecticut | 1.01 |
| 16 | Massachusetts | 1.00 |
| 17 | Louisiana | 0.99 |
| 17 | Montana | 0.99 |
| 19 | New Jersey | 0.98 |
| 20 | Michigan | 0.96 |
| 21 | Oregon | 0.95 |
| 22 | Iowa | 0.92 |
| 23 | Maryland | 0.91 |
| 24 | Indiana | 0.9 |
| 25 | New Mexico | 0.89 |
| 26 | California | 0.87 |
| 27 | Illinois | 0.85 |
| 28 | Tennessee | 0.84 |
| 29 | Idaho | 0.83 |
| 30 | Kentucky | 0.81 |
| 30 | New York | 0.81 |
| 30 | Washington | 0.81 |
| 33 | South Carolina | 0.8 |
| 34 | Hawaii | 0.79 |
| 35 | Kansas | 0.79 |
| 35 | Arizona | 0.79 |
| 37 | Mississippi | 0.78 |
| 38 | South Dakota | 0.77 |
| 39 | Vermont | 0.76 |
| 40 | Nebraska | 0.73 |
| 41 | Pennsylvania | 0.72 |
| 42 | Texas | 0.71 |
| 43 | Georgia | 0.7 |
| 43 | Virginia | 0.7 |
| 45 | Alabama | 0.69 |
| 46 | North Carolina | 0.68 |
| 47 | Oklahoma | 0.65 |
| 48 | Arkansas | 0.64 |
| 49 | Ohio | 0.62 |
| 50 | Utah | 0.57 |
| 51 | West Virginia | 0.47 |
Gallons Overall
| Rank | State | Gallons Overall |
|---|---|---|
| 1 | California | 69.1M |
| 2 | Florida | 45.8M |
| 3 | Texas | 39.5M |
| 4 | New York | 32.5M |
| 5 | Illinois | 21.9M |
| 6 | Michigan | 19.5M |
| 7 | Pennsylvania | 19M |
| 8 | New Jersey | 17.7M |
| 9 | Georgia | 14.7M |
| 9 | Wisconsin | 14.7M |
| 11 | Ohio | 14.6M |
| 12 | Massachusetts | 14.3M |
| 13 | North Carolina | 14.2M |
| 14 | Colorado | 14.1M |
| 15 | Minnesota | 13.5M |
| 16 | Missouri | 12.6M |
| 17 | Washington | 12.2M |
| 18 | Virginia | 12M |
| 19 | Indiana | 11.9M |
| 20 | Tennessee | 11.4M |
| 21 | Arizona | 11.3M |
| 22 | Maryland | 11.1M |
| 23 | Louisiana | 9.1M |
| 24 | Nevada | 8.9M |
| 25 | South Carolina | 8.3M |
| 26 | Oregon | 8.1M |
| 27 | Connecticut | 7.4M |
| 28 | Kentucky | 7.3M |
| 29 | Alabama | 6.7M |
| 30 | Iowa | 5.8M |
| 30 | New Hampshire | 5.8M |
| 32 | Oklahoma | 5M |
| 33 | Mississippi | 4.7M |
| 34 | Kansas | 4.6M |
| 35 | Arkansas | 3.9M |
| 36 | New Mexico | 3.7M |
| 37 | Utah | 3.4M |
| 38 | Delaware | 3.3M |
| 39 | Maine | 3M |
| 40 | Idaho | 2.9M |
| 41 | Nebraska | 2.8M |
| 42 | Rhode Island | 2.5M |
| 43 | Washington, D.C. | 2.4M |
| 44 | Hawaii | 2.3M |
| 45 | Montana | 2.1M |
| 46 | North Dakota | 2M |
| 47 | Alaska | 1.8M |
| 48 | West Virginia | 1.8M |
| 49 | Wyoming | 1.4M |
| 50 | South Dakota | 1.3M |
| 51 | Vermont | 1M |
*This data uses an estimate of average ethanol content of sold or shipped spirits into gallons of ethanol (pure alcohol) before calculating per capita consumption estimates. For this data, the alcohol by volume value for spirits is 0.411.
This story is a part of VP Pro, our free platform and newsletter for drinks industry professionals, covering wine, beer, liquor, and beyond. Sign up for VP Pro now!
![The States That Drink the Most Spirits in America [Map] The States That Drink the Most Spirits in America [Map]](https://vinepair.com/wp-content/uploads/2020/06/spirit-map_card-375x450.jpg)