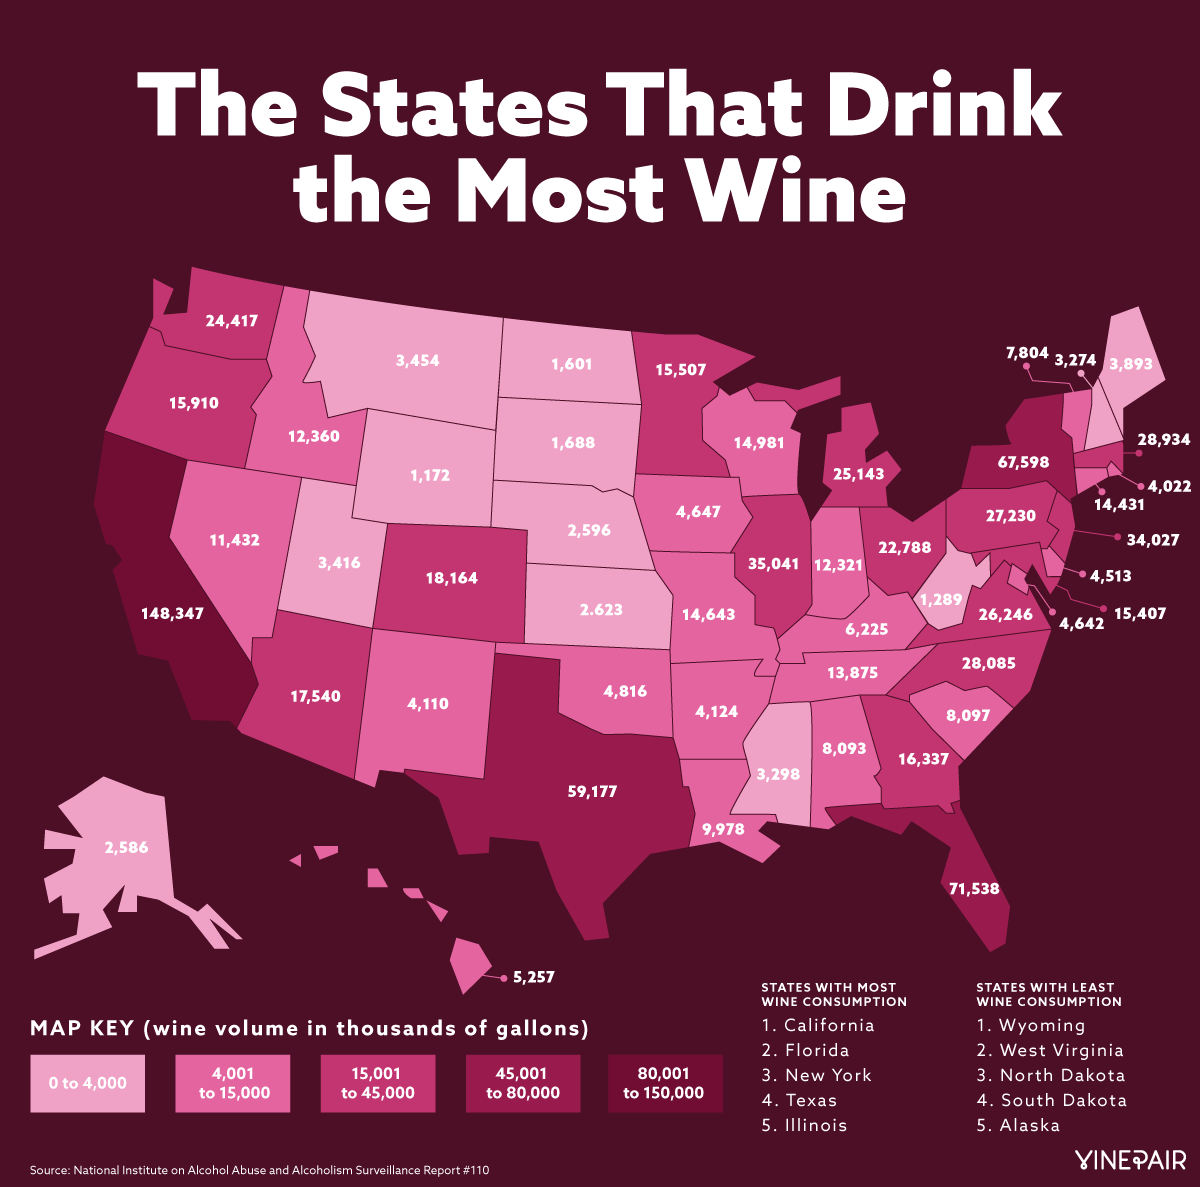
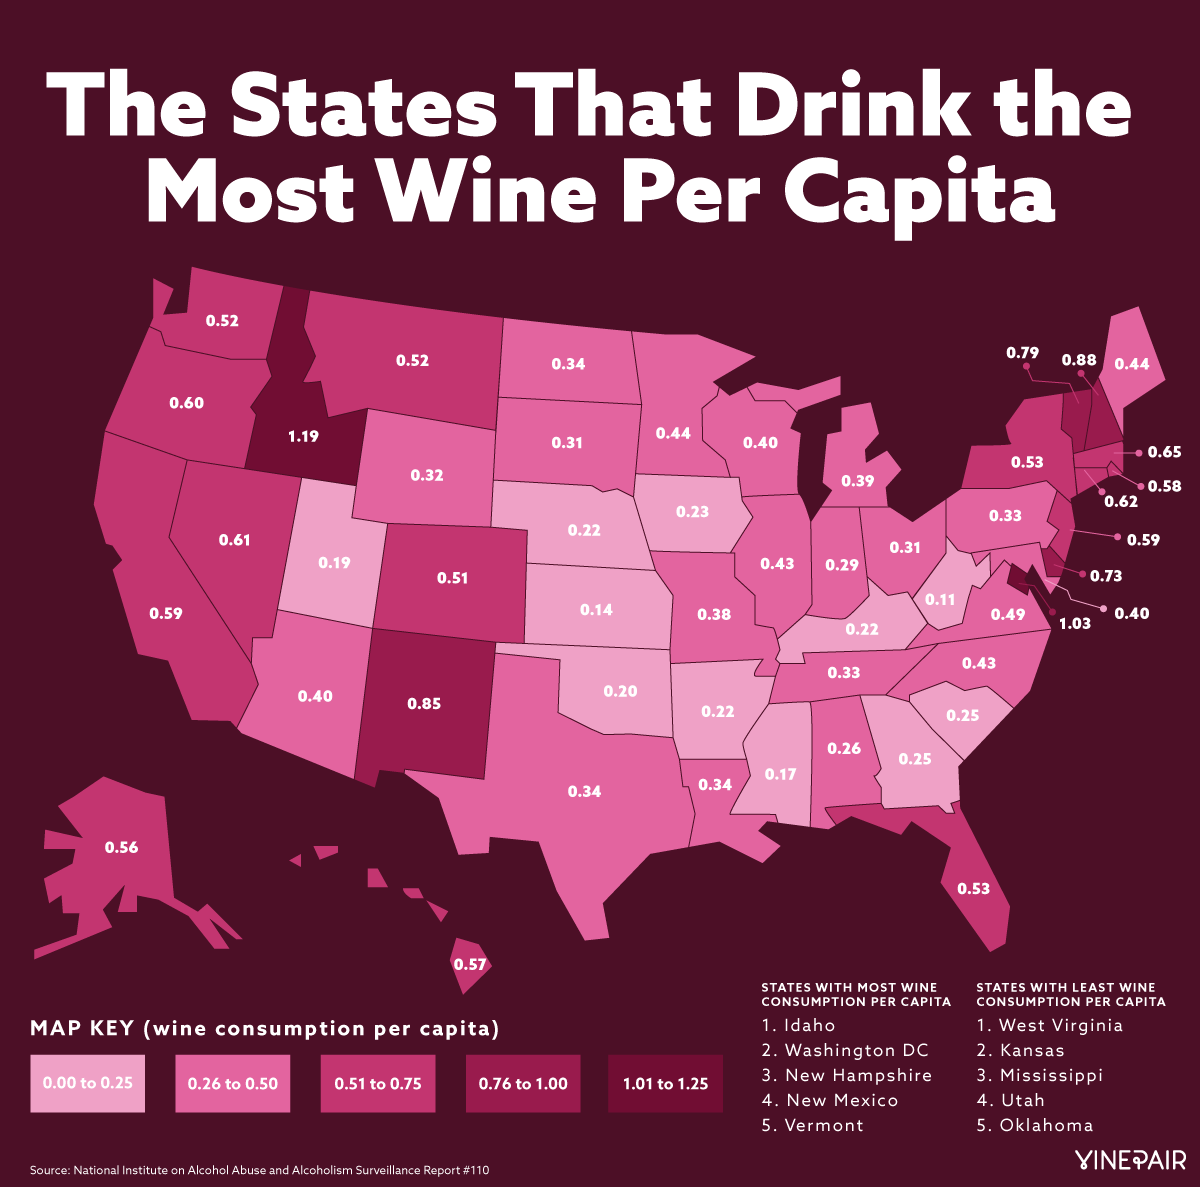
The National Institutes of Health released a report analyzing drinking trends by state, and the results are illuminating. VinePair breaks it down by each state’s overall and per capita wine consumption.
Californians drink the most wine overall. This is unsurprising, seeing as how California’s population of 39 million thirsty residents is nearly 70 times larger than that of Wyoming, the state that drank the least wine. The Golden State also happens to be responsible for 86 percent of America’s total wine output.
In per capita wine consumption, Idaho once again leads the way, followed by DC, New Hampshire, New Mexico, and Vermont.
Researchers looked primarily at alcoholic beverage sales by state from 1977 to 2015, and then updated their records with these figures from 2016. When statewide alcohol sales or tax receipts reports were unavailable, the surveyors considered control states and shipment data to supplement their findings.
Curious to see how your state stacks up to its neighbors? Check out VinePair’s maps.

Per capita consumption is arguably a clearer representation of boots-on-the-ground drinking trends. It’s worth noting that New Hampshire’s low alcohol taxes likely contribute to its high per capita rank.

