
When considering all the obstacles craft brewers faced last year, the recently reported 9 percent production decline of 2020 feels less like a tragedy and more like a miracle.
In a year like no other, small and independent brewers had to wrestle with taproom closures and extended periods of little to no income from selling kegs to on-premise accounts. When many turned to packaging their beers for the first time, they were met with widespread aluminum can shortages. And all arrived at a time of ever-increasing competition — both for cans and drinkers — from RTD cocktails and hard seltzer.
So while we will all be hoping for a strong production uptick this year, it’s worth tipping our caps to craft brewers and the resilience shown in 2020.
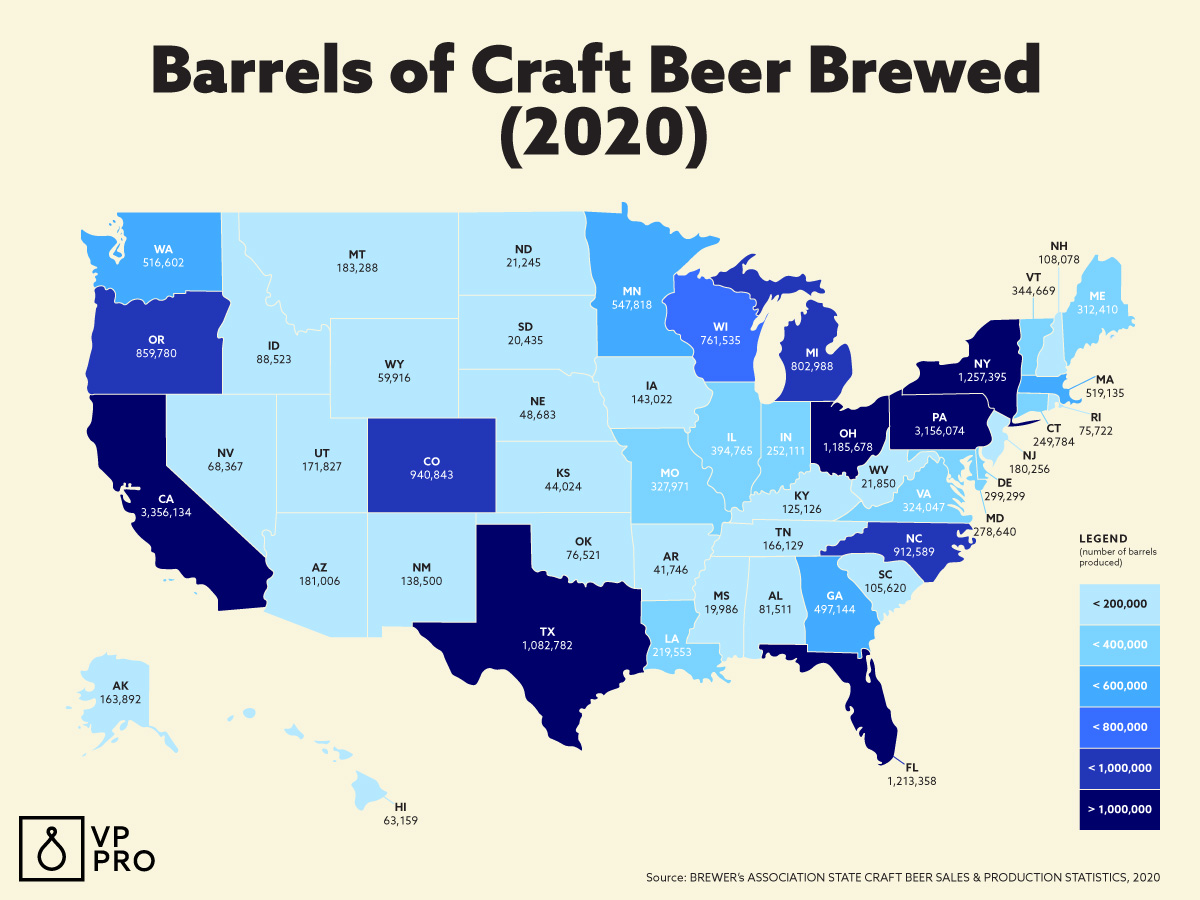
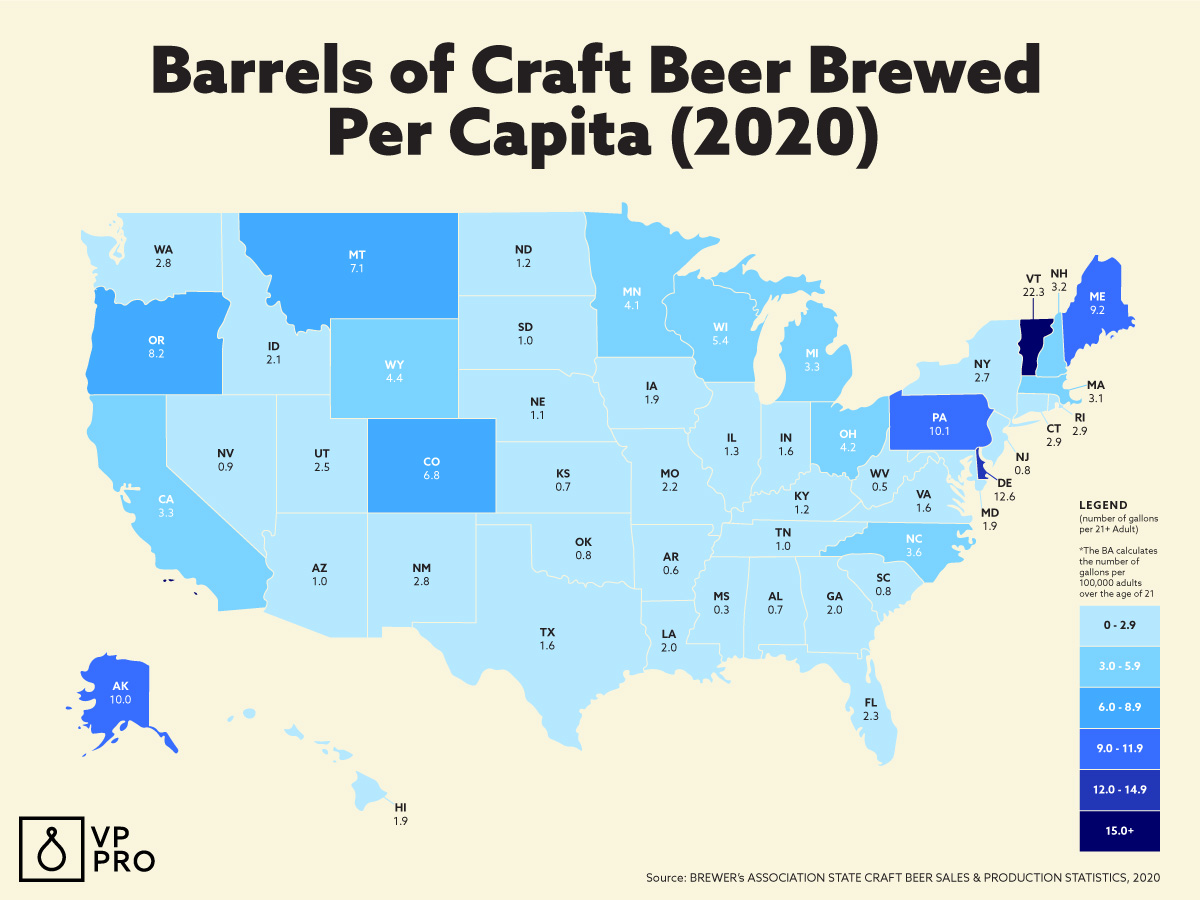
To gain a better picture of what last year’s craft beer production looked like on a more granular, state-by-state level, we used data published by the Brewers Association to create the following two maps. The first demonstrates the total number of barrels produced in each state, while the second shows how that figure compares on a ratio of barrels per adult resident (over 21 years old).
Find out how your state ranked for each field in 2020 in the maps below.
This story is a part of VP Pro, our free platform and newsletter for drinks industry professionals, covering wine, beer, liquor, and beyond. Sign up for VP Pro now!