![The States That Drink the Most Beer in America (2024) [MAP]](https://vinepair.com/wp-content/uploads/2025/01/states-that-drink-the-most-beer-in-america-2025-card-375x450.jpg "The States That Drink the Most Beer in America (2024) [MAP]")
Americans love beer. According to new data from the National Institute on Alcohol Abuse and Alcoholism (NIAAA), 6.3 billion gallons of beer were consumed in the United States in 2022. It’s an amount that makes wine’s 910 million gallons and spirits’ 715 million gallons pale in comparison. But consumption habits tend to vary from region to region.
The South drinks the most beer by a mile, with a whopping 2.4 billion gallons consumed. That’s nearly 1 billion gallons more than the West, which ranks second with 1.5 billion gallons consumed in 2022. Consuming the least is the Northeast, which reports just over 1 billion gallons. However, when broken down per capita, it’s actually the West that drinks the most beer, with 1.06 gallons consumed per year per person. The Northeast still ranks last with 0.96 gallons per capita, while the Midwest and South report 1.04 gallons and 1.01 gallons per capita, respectively.
Interested to see how your state stacks up? Check out our maps below to discover how much beer every state drinks by volume and per capita. And check out our map of the states that drink the most alcohol in America.
The States That Drink the Most Beer Per Capita
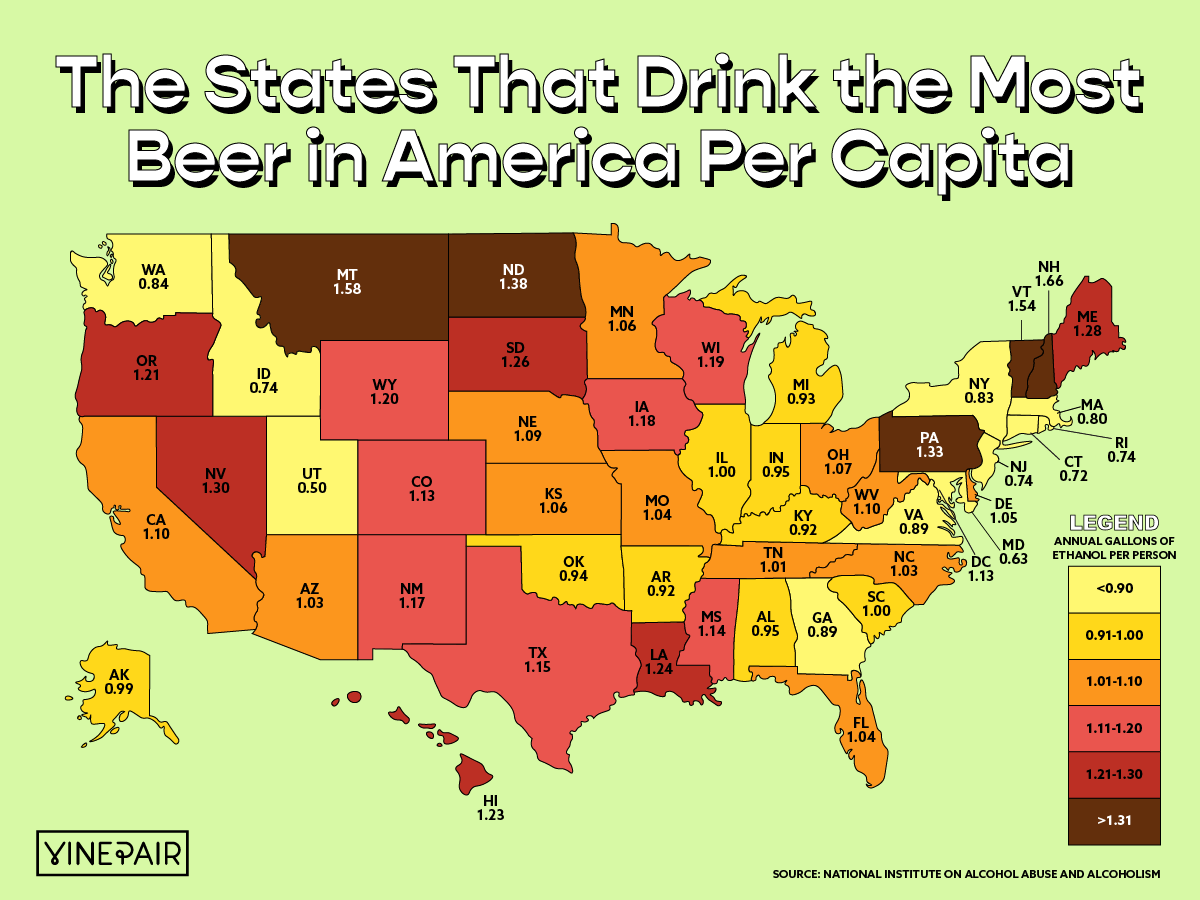
Per capita, New Hampshire appears to drink the most beer, but it’s important to note that the state does not have a sales tax on alcohol. As such, it’s likely that drinkers from neighboring states cross the border to stock up on booze, thus inflating the state’s apparent consumption. Montana is second, while Vermont rounds out the top three. At the bottom end, Utah, which has some of the strictest alcohol laws in the country, drinks the least per capita with just 0.5 gallons.
The States That Drink the Most Beer in Ethanol
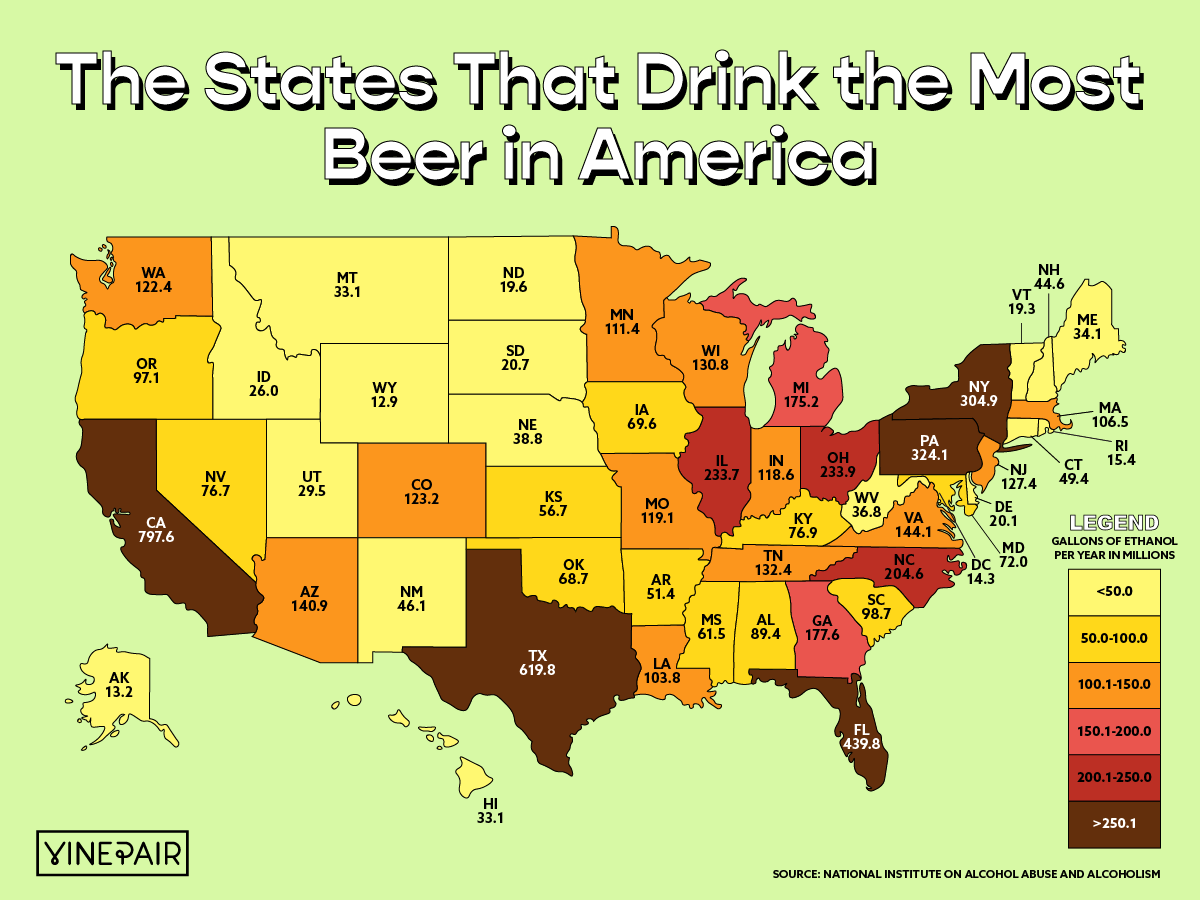
In what shouldn’t come as a surprise, the states with the largest populations tend to be the ones that consume the most alcohol. As such, the nation’s most populous states — California, Texas, and Florida — claim the top three spots with 797.6 million, 619.8 million, and 439.8 million gallons, respectively. Wyoming, the least populated state, drinks the least beer by volume, with just 12.9 million gallons consumed.
Ranking the States
Gallons per Capita
| Rank | State | Gallons of Ethanol Per Capita* |
|---|---|---|
| 1 | New Hampshire | 1.66 |
| 2 | Montana | 1.58 |
| 3 | Vermont | 1.54 |
| 4 | North Dakota | 1.38 |
| 5 | Pennsylvania | 1.33 |
| 6 | Nevada | 1.30 |
| 7 | Maine | 1.28 |
| 8 | South Dakota | 1.26 |
| 9 | Louisiana | 1.24 |
| 10 | Hawaii | 1.23 |
| 11 | Oregon | 1.21 |
| 12 | Wyoming | 1.20 |
| 13 | Wisconsin | 1.19 |
| 14 | Iowa | 1.18 |
| 15 | New Mexico | 1.17 |
| 16 | Texas | 1.15 |
| 17 | Mississippi | 1.14 |
| 18 | Colorado | 1.13 |
| 19 | Washington, D.C. | 1.13 |
| 20 | California | 1.10 |
| 21 | West Virginia | 1.10 |
| 22 | Nebraska | 1.09 |
| 23 | Ohio | 1.07 |
| 24 | Kansas | 1.06 |
| 25 | Minnesota | 1.06 |
| 26 | Delaware | 1.05 |
| 27 | Florida | 1.04 |
| 28 | Missouri | 1.04 |
| 29 | Arizona | 1.03 |
| 30 | North Carolina | 1.03 |
| 31 | Tennessee | 1.01 |
| 32 | Illinois | 1.00 |
| 33 | South Carolina | 1.00 |
| 34 | Alaska | 0.99 |
| 35 | Alabama | 0.95 |
| 36 | Indiana | 0.95 |
| 37 | Oklahoma | 0.94 |
| 38 | Michigan | 0.93 |
| 39 | Arkansas | 0.92 |
| 40 | Kentucky | 0.92 |
| 41 | Georgia | 0.89 |
| 42 | Virginia | 0.89 |
| 43 | Washington | 0.84 |
| 44 | New York | 0.83 |
| 45 | Massachusetts | 0.80 |
| 46 | Idaho | 0.74 |
| 47 | New Jersey | 0.74 |
| 48 | Rhode Island | 0.74 |
| 49 | Connecticut | 0.72 |
| 50 | Maryland | 0.63 |
| 51 | Utah | 0.50 |
Gallons Overall
| Rank | State | Gallons of Beer Overall |
|---|---|---|
| 1 | California | 797.6M |
| 2 | Texas | 619.8M |
| 3 | Florida | 439.8M |
| 4 | Pennsylvania | 324.1M |
| 5 | New York | 304.9M |
| 6 | Ohio | 233.9M |
| 7 | Illinois | 233.7M |
| 8 | North Carolina | 204.6M |
| 9 | Georgia | 177.6M |
| 10 | Michigan | 175.2M |
| 11 | Virginia | 144.1M |
| 12 | Arizona | 140.9M |
| 13 | Tennessee | 132.4M |
| 14 | Wisconsin | 130.8M |
| 15 | New Jersey | 127.4M |
| 16 | Colorado | 123.2M |
| 17 | Washington | 122.4M |
| 18 | Missouri | 119.1M |
| 19 | Indiana | 118.6M |
| 20 | Minnesota | 111.4M |
| 21 | Massachusetts | 106.5M |
| 22 | Louisiana | 103.8M |
| 23 | South Carolina | 98.7M |
| 24 | Oregon | 97.1M |
| 25 | Alabama | 89.4M |
| 26 | Kentucky | 76.9M |
| 27 | Nevada | 76.7M |
| 28 | Maryland | 72.0M |
| 29 | Iowa | 69.6M |
| 30 | Oklahoma | 68.7M |
| 31 | Mississippi | 61.5M |
| 32 | Kansas | 56.7M |
| 33 | Arkansas | 51.4M |
| 34 | Connecticut | 49.4M |
| 35 | New Mexico | 46.1M |
| 36 | New Hampshire | 44.6M |
| 37 | Nebraska | 38.8M |
| 38 | West Virginia | 36.8M |
| 39 | Maine | 34.1M |
| 40 | Hawaii | 33.1M |
| 41 | Montana | 33.1M |
| 42 | Utah | 29.5M |
| 43 | Idaho | 26.0M |
| 44 | South Dakota | 20.7M |
| 45 | Delaware | 20.1M |
| 46 | North Dakota | 19.6M |
| 47 | Vermont | 19.3M |
| 48 | Rhode Island | 15.4M |
| 49 | Washington, D.C. | 14.3M |
| 50 | Alaska | 13.2M |
| 51 | Wyoming | 12.9M |
*This data uses an estimate of average ethanol content of sold or shipped beer into gallons of ethanol (pure alcohol) before calculating per capita consumption estimates. For this data, the alcohol by volume value for beer is 0.045.
*Image retrieved from Odelia Cohen via stock.adobe.com