![The States That Drink the Most Beer in America (2022) [Map]](https://vinepair.com/wp-content/uploads/2023/03/states-that-drink-the-most-beer-in-america-infographic-card-375x450.jpg "The States That Drink the Most Beer in America (2022) [Map]")
Americans love their beer. With over 9,000 breweries operating in the United States, there’s no shortage of craft or macro brews for stateside beer lovers to try out. Of the three beverage categories — beer, wine, and spirits — beer is overwhelmingly the most drunk, with over 6.4 billion gallons consumed per year compared to wine’s 931 million and spirits’ 635 million, according to the National Institute on Alcohol Abuse and Alcoholism.
Here at VinePair, we were curious to learn how beer consumption varies by state. Surprisingly, highly populated states including California, Texas, and Florida consume the most by volume, but it’s smaller, much less populous states that secure the top three spots in per capita consumption.
Curious to see where your state ranks when it comes to annual beer consumption? Check out our color-coded maps depicting state-by-state beer consumption by volume and per capita below!
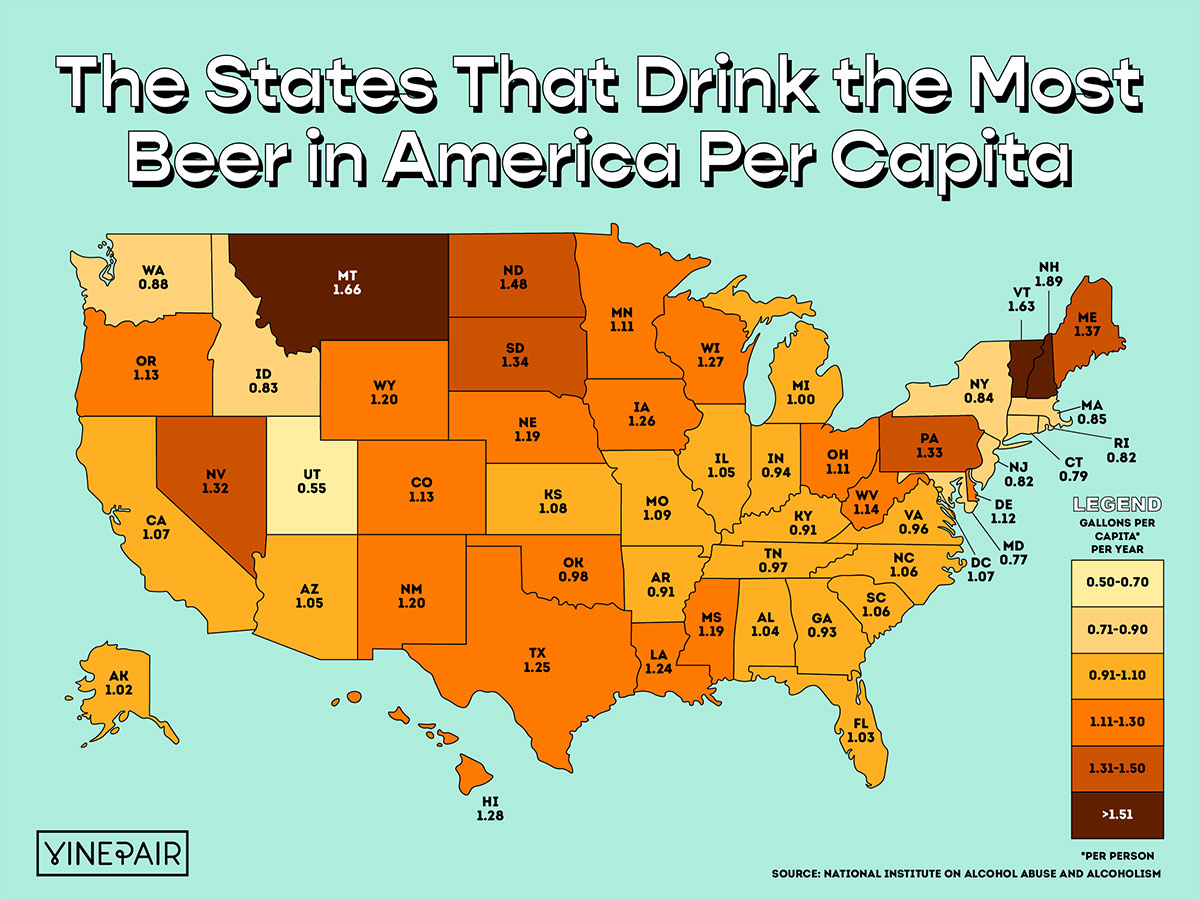
The States That Drink the Most Beer Per Capita
While New Hampshire appears to consume the most beer per capita, the state’s high beer sales are aided by residents of other states taking advantage of New Hampshire’s lack of booze tax. Interestingly, rounding out the top five are the less populous states of Montana, Vermont, North Dakota, and Maine.
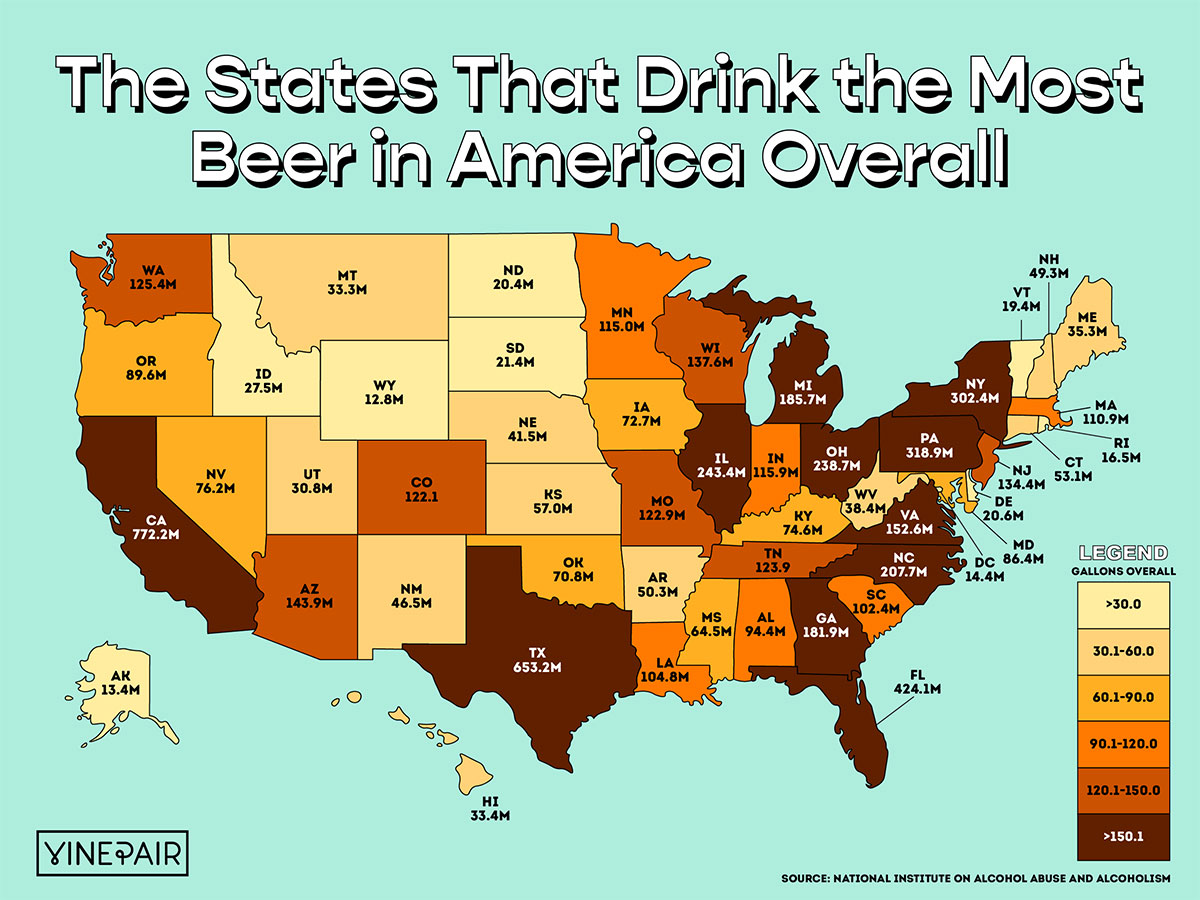
The States That Drink The Most Beer Overall
Naturally, the most populous states in the U.S. consume the most beer by volume. California leads the pack with over 772 million gallons consumed per annum. Rounding out the top five states that drink the most beer are Texas, Florida, Pennsylvania, and New York, respectively.
Ranking the States: Gallons Per Capita
| Rank | State | Gallons of Ethanol Per Capita* |
|---|---|---|
| 1 | New Hampshire | 1.89 |
| 2 | Montana | 1.66 |
| 3 | Vermont | 1.63 |
| 4 | North Dakota | 1.48 |
| 5 | Maine | 1.37 |
| 6 | South Dakota | 1.34 |
| 7 | Pennsylvania | 1.33 |
| 8 | Nevada | 1.32 |
| 9 | Hawaii | 1.28 |
| 10 | Wisconsin | 1.27 |
| 11 | Iowa | 1.26 |
| 12 | Texas | 1.25 |
| 13 | Louisiana | 1.24 |
| 14 | New Mexico | 1.20 |
| 15 | Wyoming | 1.20 |
| 16 | Mississippi | 1.19 |
| 17 | Nebraska | 1.19 |
| 18 | West Virginia | 1.14 |
| 19 | Colorado | 1.13 |
| 20 | Oregon | 1.13 |
| 21 | Delaware | 1.12 |
| 22 | Minnesota | 1.11 |
| 23 | Ohio | 1.11 |
| 24 | Missouri | 1.09 |
| 25 | Kansas | 1.08 |
| 26 | California | 1.07 |
| 27 | Washington D.C. | 1.07 |
| 28 | North Carolina | 1.06 |
| 29 | South Carolina | 1.06 |
| 30 | Arizona | 1.05 |
| 31 | Illinois | 1.05 |
| 32 | Alabama | 1.04 |
| 33 | Florida | 1.03 |
| 34 | Alaska | 1.02 |
| 35 | Michigan | 1.00 |
| 36 | Oklahoma | 0.98 |
| 37 | Tennessee | 0.97 |
| 38 | Virginia | 0.96 |
| 39 | Indiana | 0.94 |
| 40 | Georgia | 0.93 |
| 41 | Arkansas | 0.91 |
| 42 | Kentucky | 0.91 |
| 43 | Washington | 0.88 |
| 44 | Massachusetts | 0.85 |
| 45 | New York | 0.84 |
| 46 | Idaho | 0.83 |
| 47 | New Jersey | 0.82 |
| 48 | Rhode Island | 0.82 |
| 49 | Connecticut | 0.79 |
| 50 | Maryland | 0.77 |
| 51 | Utah | 0.55 |
Ranking the States: Gallons Overall
| Rank | State | Gallons Overall |
|---|---|---|
| 1 | California | 772.2M |
| 2 | Texas | 653.2M |
| 3 | Florida | 424.1M |
| 4 | Pennsylvania | 318.9M |
| 5 | New York | 302.4M |
| 6 | Illinois | 243.4M |
| 7 | Ohio | 238.7M |
| 8 | North Carolina | 207.7M |
| 9 | Michigan | 185.7M |
| 10 | Georgia | 181.9M |
| 11 | Virginia | 152.6M |
| 12 | Arizona | 143.9M |
| 13 | Wisconsin | 137.6M |
| 14 | New Jersey | 134.4M |
| 15 | Washington | 125.4M |
| 16 | Tennessee | 123.9M |
| 17 | Missouri | 122.9M |
| 18 | Colorado | 122.1M |
| 19 | Indiana | 115.9M |
| 20 | Minnesota | 115.0M |
| 21 | Massachusetts | 110.9M |
| 22 | Louisiana | 104.8M |
| 23 | South Carolina | 102.4M |
| 24 | Alabama | 94.4M |
| 25 | Oregon | 89.6M |
| 26 | Maryland | 86.4M |
| 27 | Nevada | 76.2M |
| 28 | Kentucky | 74.6M |
| 29 | Iowa | 72.7M |
| 30 | Oklahoma | 70.8M |
| 31 | Mississippi | 64.5M |
| 32 | Kansas | 57.0M |
| 33 | Connecticut | 53.1M |
| 34 | Arkansas | 50.3M |
| 35 | New Hampshire | 49.3M |
| 36 | New Mexico | 46.5M |
| 37 | Nebraska | 41.5M |
| 38 | West Virginia | 38.4M |
| 39 | Maine | 35.3M |
| 40 | Hawaii | 33.4M |
| 41 | Montana | 33.3M |
| 42 | Utah | 30.8M |
| 43 | Idaho | 27.5M |
| 44 | South Dakota | 21.4M |
| 45 | Delaware | 20.6M |
| 46 | North Dakota | 20.4M |
| 47 | Vermont | 19.4M |
| 48 | Rhode Island | 16.5M |
| 49 | Washington D.C. | 14.4M |
| 50 | Alaska | 13.4M |
| 51 | Wyoming | 12.8M |
*This data uses an estimate of average ethanol content of sold or shipped beer into gallons of ethanol (pure alcohol) before calculating per capita consumption estimates. For this data, the alcohol by volume value for beer is 0.045.
*Image sourced from Meritt Thomas – Unsplash.com