![Which States Have the Most Bartenders? [MAP]](https://vinepair.com/wp-content/uploads/2022/04/bartenders_map_card-375x450.jpg "Which States Have the Most Bartenders? [MAP]")
No longer regarded as just a temporary gig or hobby, bartending has quickly become a popular career path with increasing growth projections. According to the Bureau of Labor Statistics (BLS), there are an average of 111,300 job openings for bartenders projected each year; that astonishing number is calculated to grow 32 percent from 2020 to 2030.
The growing drinks landscape and interest in craft cocktails in America have also played a role in the industry’s growth, with a marked uptick in opportunities for work in restaurants, bars, facilities, beverage manufacturing, and during social events, which have widely resumed post-pandemic.
Naturally, the number of employed bartenders depends on the overall population of the state as well as the local appetite for the food and beverage industry. But in the spring of 2021, cities across the United States started to see a reduction in Covid restrictions as more facilities returned to full capacity, a shift that undoubtedly continues to play a role in the number of working bartenders.
As bartending opportunities continue to grow, states have seen the industry flourish in surprising numbers. For example, Massachusetts employs more than 11,000 bartenders, relative to larger states like Washington, which employs just 9,810.
Interested to know just how many bartenders your state employs and how the most popular dining and nightlife cities compare to one another? Check the map below for all the info.
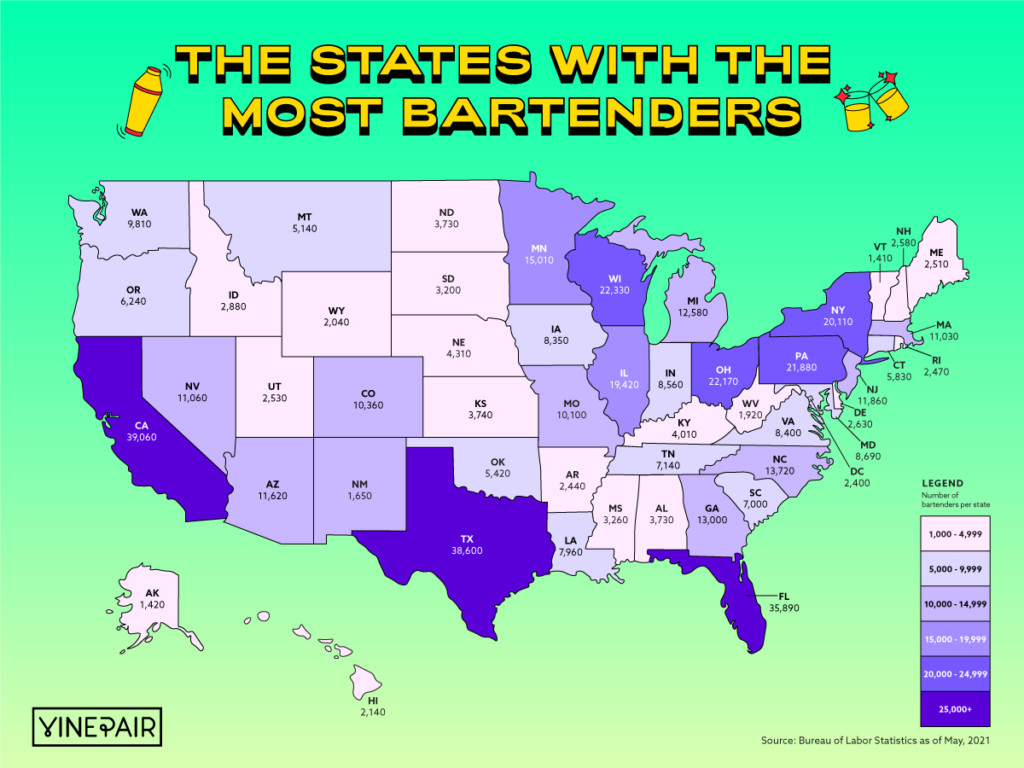
The Number of Bartenders by State
| State | Bartenders |
| California | 39,060 |
| Texas | 38,600 |
| Florida | 35,890 |
| Wisconsin | 22,330 |
| Ohio | 22,170 |
| Pennsylvania | 21,880 |
| New York | 20,110 |
| Illinois | 19,420 |
| Minnesota | 15,010 |
| North Carolina | 13,720 |
| Georgia | 13,000 |
| Michigan | 12,580 |
| New Jersey | 11,860 |
| Arizona | 11,620 |
| Nevada | 11,060 |
| Massachusetts | 11,030 |
| Colorado | 10,360 |
| Missouri | 10,100 |
| Washington | 9,810 |
| Maryland | 8,690 |
| Indiana | 8,560 |
| Virginia | 8,400 |
| Iowa | 8,400 |
| Louisiana | 7,960 |
| Tennessee | 7,140 |
| South Carolina | 7,000 |
| Oregon | 6,240 |
| Connecticut | 5,830 |
| Oklahoma | 5,420 |
| Montana | 5,140 |
| Nebraska | 4,310 |
| Kentucky | 4,010 |
| Kansas | 3,740 |
| Alabama | 3,730 |
| North Dakota | 3,730 |
| Mississippi | 3,260 |
| South Dakota | 3,200 |
| Idaho | 2,880 |
| Delaware | 2,630 |
| Utah | 2,530 |
| Maine | 2,510 |
| Rhode Island | 2,470 |
| Arkansas | 2,440 |
| Washington D.C | 2,400 |
| Hawaii | 2,140 |
| Wyoming | 2,040 |
| West Virginia | 1,920 |
| New Mexico | 1,650 |
| Alaska | 1,420 |
| Vermont | 1,410 |
| Total | 485,340 |
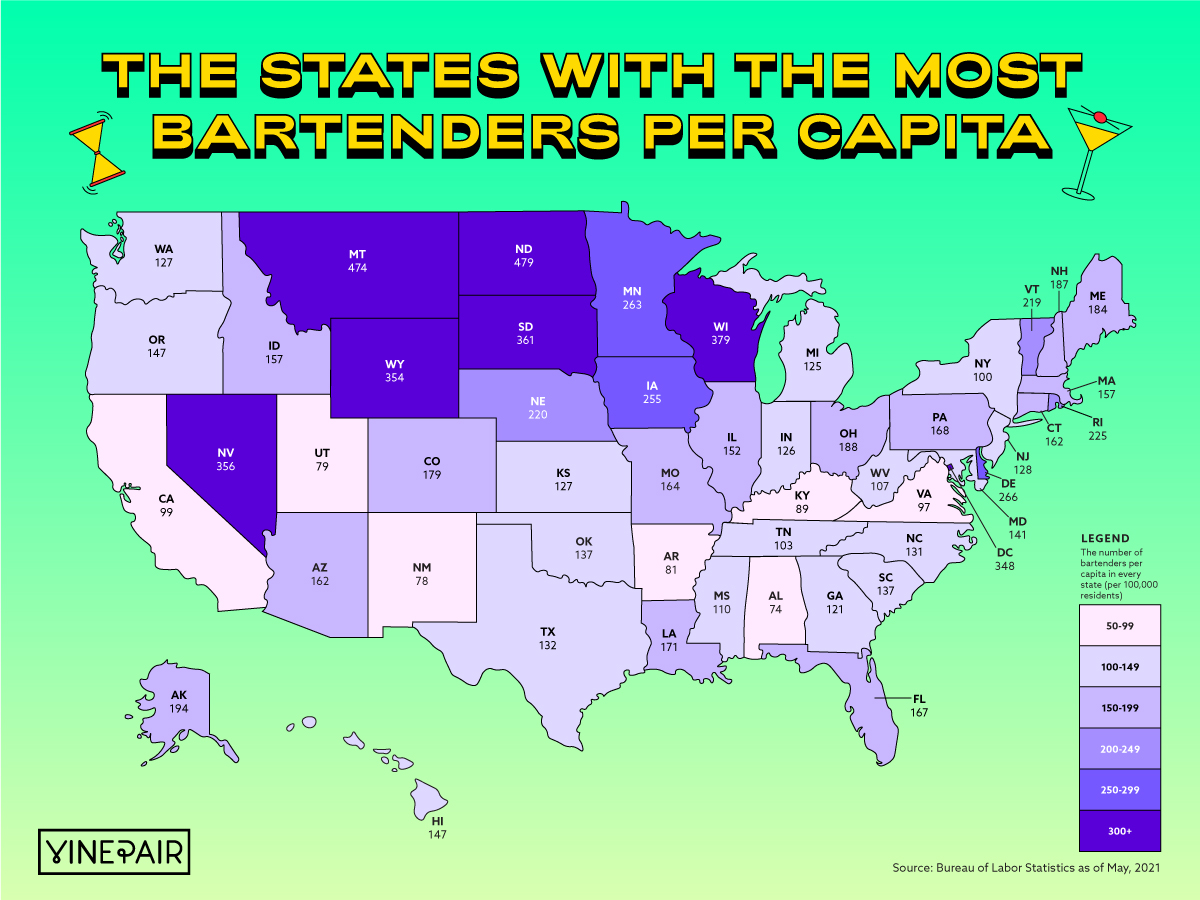
The Number of Bartenders Per Capita by State
| State | Bartenders per capita |
| North Dakota | 478.76 |
| Montana | 474.07 |
| Wisconsin | 378.88 |
| South Dakota | 360.9 |
| Nevada | 356.24 |
| Wyoming | 353.64 |
| Washington, D.C | 348.06 |
| Deleware | 265.67 |
| Minnesota | 263.03 |
| Iowa | 255.23 |
| Rhode Island | 225.08 |
| Nebraska | 219.73 |
| Vermont | 219.26 |
| Alaska | 193.62 |
| Ohio | 187.89 |
| New Hampshire | 187.29 |
| Maine | 184.24 |
| Colorado | 179.43 |
| Louisiana | 170.9 |
| Pennsylvania | 168.27 |
| Florida | 166.63 |
| Missouri | 164.1 |
| Arizona | 162.48 |
| Connecticut | 161.68 |
| Massachusetts | 156.9 |
| Idaho | 156.6 |
| Illinois | 151.7 |
| Oregon | 147.27 |
| Hawaii | 147.05 |
| Maryland | 140.68 |
| Oklahoma | 136.89 |
| South Carolina | 136.76 |
| Texas | 132.44 |
| North Carolina | 131.43 |
| Colorado | 179.43 |
| Wisconsin | 378.88 |
| Illinois | 151.7 |
| Florida | 166.63 |
| Maryland | 140.68 |
| Iowa | 255.23 |
| Rhode Island | 225.08 |
| Nebraska | 219.73 |
| Vermont | 219.26 |
| Alaska | 193.62 |
| Ohio | 187.89 |
| New Hampshire | 187.29 |
| Maine | 184.24 |
| Colorado | 179.43 |
| Louisiana | 170.9 |
| Pennsylvania | 168.27 |
| Florida | 166.63 |
| Missouri | 164.1 |
| Arizona | 162.48 |
| Connecticut | 161.68 |
| Massachusetts | 156.9 |
| Idaho | 156.6 |
| Illinois | 151.7 |
| Oregon | 147.27 |
| Hawaii | 147.05 |
| Maryland | 140.68 |
| Oklahoma | 136.89 |
| South Carolina | 136.76 |
| Texas | 132.44 |
| North Carolina | 131.43 |
| New Jersey | 127.68 |
| Washington | 127.32 |
| Kansas | 127.3 |
| Indiana | 126.15 |
| Michigan | 124.83 |
| Georgia | 121.36 |
| Mississippi | 110.09 |
| West Virginia | 107.04 |
| Tennesse | 103.32 |
| New York | 99.55 |
| California | 98.79 |
| Virginia | 97.32 |
| Kentucky | 89 |
| Arkansas | 81.02 |
| Utah | 78.92 |
| New Mexico | 77.92 |
| Alabama | 74.24 |
| Total | 9334.65 |