![Where Does Your State Rank In Craft Beer Production? [MAPS]](http://vinepair.com/wp-content/themes/vpcontent/images/blank.gif)
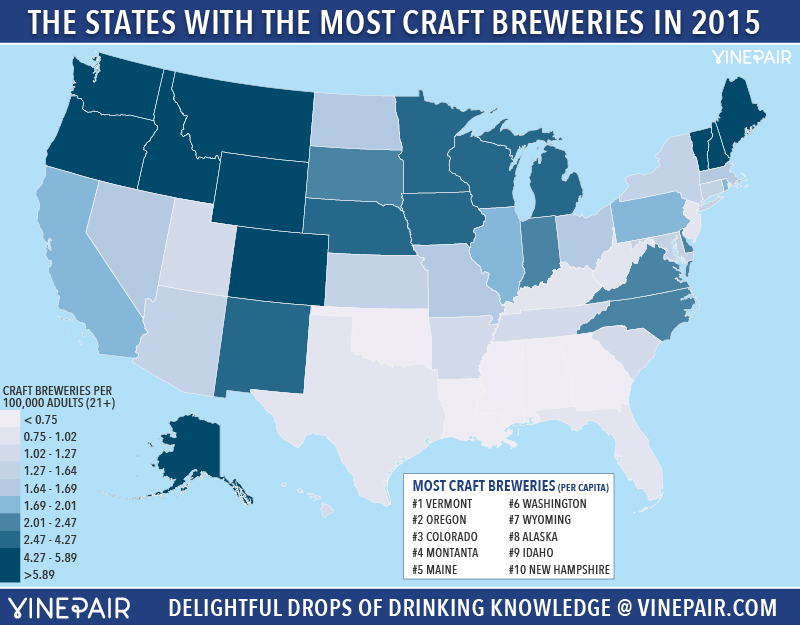
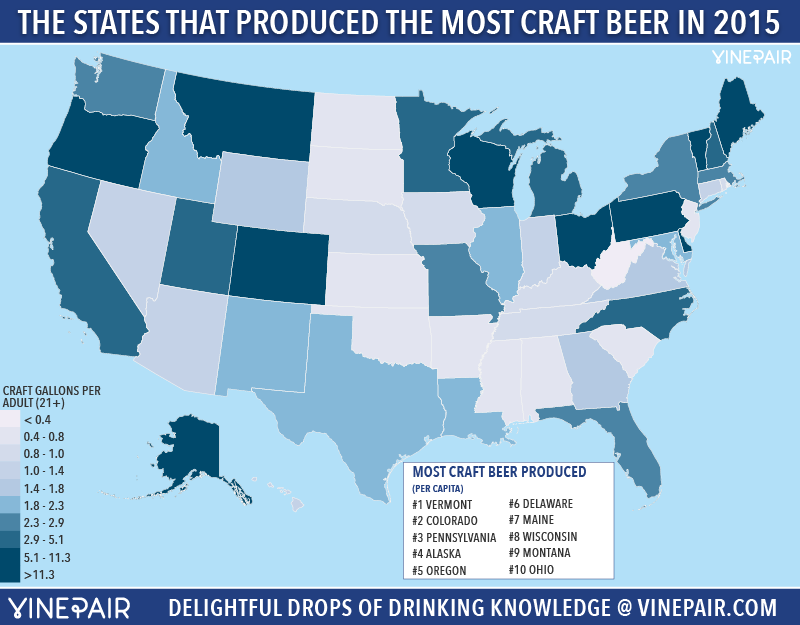
The number of craft breweries in America continues to grow, but even with this growth, some states still have more breweries and beer than others. Who would have ever thought tiny Vermont would pump out the most craft beer per capita in the nation? This means they have more than six breweries for every 100,000 adults in the state. Which means there is more to Vermont than simply Heady Topper. A lot of the top 10 are basically the ones you’d expect, but a few outliers slip in as well. Check out the maps below to see where your state falls.
MAP: The Number Of Craft Breweries (2015)
MAP: The Amount Of Craft Beer Produced (2015)
The Raw Data
| State | Craft Breweries / 100,000 21+ Adults | Craft Breweries / Per Capita Rank | Gallons Produced / 21+ Adult | Production / Per Capita Rank |
| Vermont | 9.42 | 1 | 17.4 | 1 |
| Oregon | 7.58 | 2 | 11.3 | 5 |
| Colorado | 7.18 | 3 | 14.1 | 2 |
| Montana | 6.47 | 4 | 7.0 | 9 |
| Maine | 5.89 | 5 | 8.9 | 7 |
| Washington | 5.84 | 6 | 2.5 | 19 |
| Wyoming | 5.47 | 7 | 1.6 | 30 |
| Alaska | 5.28 | 8 | 12.7 | 4 |
| Idaho | 4.34 | 9 | 1.9 | 25 |
| New Hampshire | 4.27 | 10 | 3.0 | 15 |
| New Mexico | 3.06 | 11 | 1.8 | 27 |
| Michigan | 2.88 | 12 | 3.3 | 13 |
| Wisconsin | 2.78 | 13 | 7.6 | 8 |
| Minnesota | 2.66 | 14 | 5.0 | 11 |
| Iowa | 2.59 | 15 | 0.8 | 41 |
| Nebraska | 2.47 | 16 | 0.9 | 38 |
| Indiana | 2.46 | 17 | 1.2 | 34 |
| South Dakota | 2.31 | 18 | 0.4 | 47 |
| North Carolina | 2.22 | 19 | 2.9 | 16 |
| Delaware | 2.04 | 20 | 11.2 | 6 |
| Virginia | 2.01 | 21 | 1.4 | 31 |
| District of Columbia | 1.92 | 22 | 1.8 | 28 |
| Pennsylvania | 1.88 | 23 | 13.4 | 3 |
| California | 1.86 | 24 | 4.3 | 12 |
| Rhode Island | 1.80 | 25 | 0.8 | 40 |
| Illinois | 1.69 | 26 | 2.0 | 22 |
| Ohio | 1.68 | 27 | 5.1 | 10 |
| Massachusetts | 1.68 | 28 | 2.8 | 17 |
| Nevada | 1.65 | 29 | 1.0 | 36 |
| Missouri | 1.64 | 30 | 2.6 | 18 |
| North Dakota | 1.64 | 31 | 0.5 | 44 |
| Arizona | 1.63 | 32 | 1.2 | 33 |
| New York | 1.40 | 33 | 2.3 | 21 |
| Maryland | 1.38 | 34 | 1.8 | 26 |
| Connecticut | 1.33 | 35 | 1.2 | 32 |
| Kansas | 1.27 | 36 | 0.7 | 43 |
| Arkansas | 1.22 | 37 | 0.4 | 50 |
| Utah | 1.16 | 38 | 3.0 | 14 |
| Hawaii | 1.14 | 39 | 1.2 | 35 |
| Tennessee | 1.07 | 40 | 0.9 | 37 |
| South Carolina | 1.02 | 41 | 0.7 | 42 |
| Texas | 1.00 | 42 | 1.9 | 24 |
| Florida | 0.99 | 43 | 2.5 | 20 |
| West Virginia | 0.87 | 44 | 0.3 | 51 |
| New Jersey | 0.77 | 45 | 0.4 | 49 |
| Kentucky | 0.75 | 46 | 0.8 | 39 |
| Alabama | 0.69 | 47 | 0.4 | 45 |
| Georgia | 0.62 | 48 | 1.6 | 29 |
| Louisiana | 0.60 | 49 | 1.9 | 23 |
| Oklahoma | 0.51 | 50 | 0.4 | 48 |
| Mississippi | 0.37 | 51 | 0.4 | 46 |
Data via The Brewers Association
![Where Does Your State Rank In Craft Beer Production? [MAPS] Where Does Your State Rank In Craft Beer Production? [MAPS]](https://vinepair.com/wp-content/themes/miladys/src/assets/images/article-card-small.png)

