![The States that Drink the Most Wine in America [Map]](https://vinepair.com/wp-content/uploads/2020/06/winemap_card-375x450.jpg "The States that Drink the Most Wine in America [Map]")
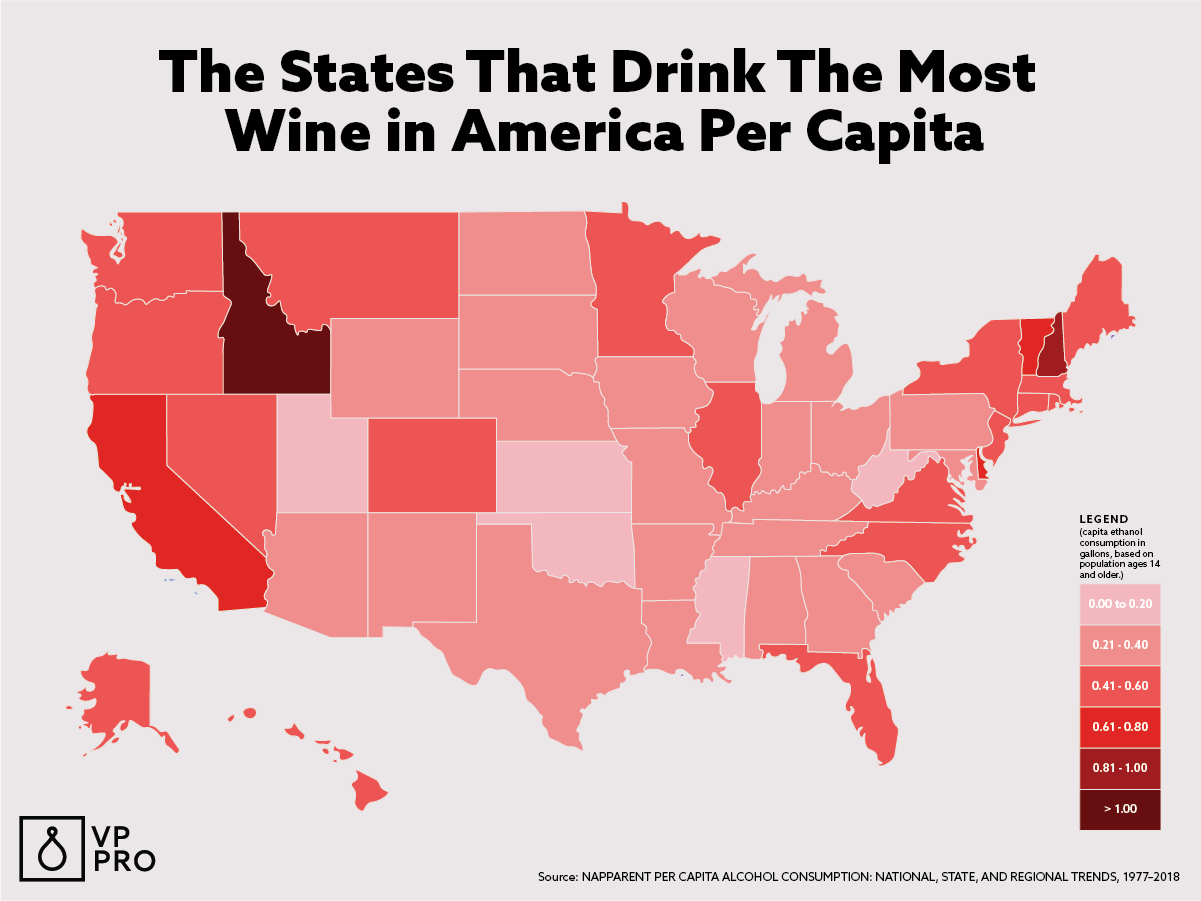
Thought Californians and Oregonians were drinking the most wine in America? Think again: Per-capita wine consumption in each of these wine-producing regions pales in comparison to other states, including Idaho, where the number of wineries is rapidly growing.
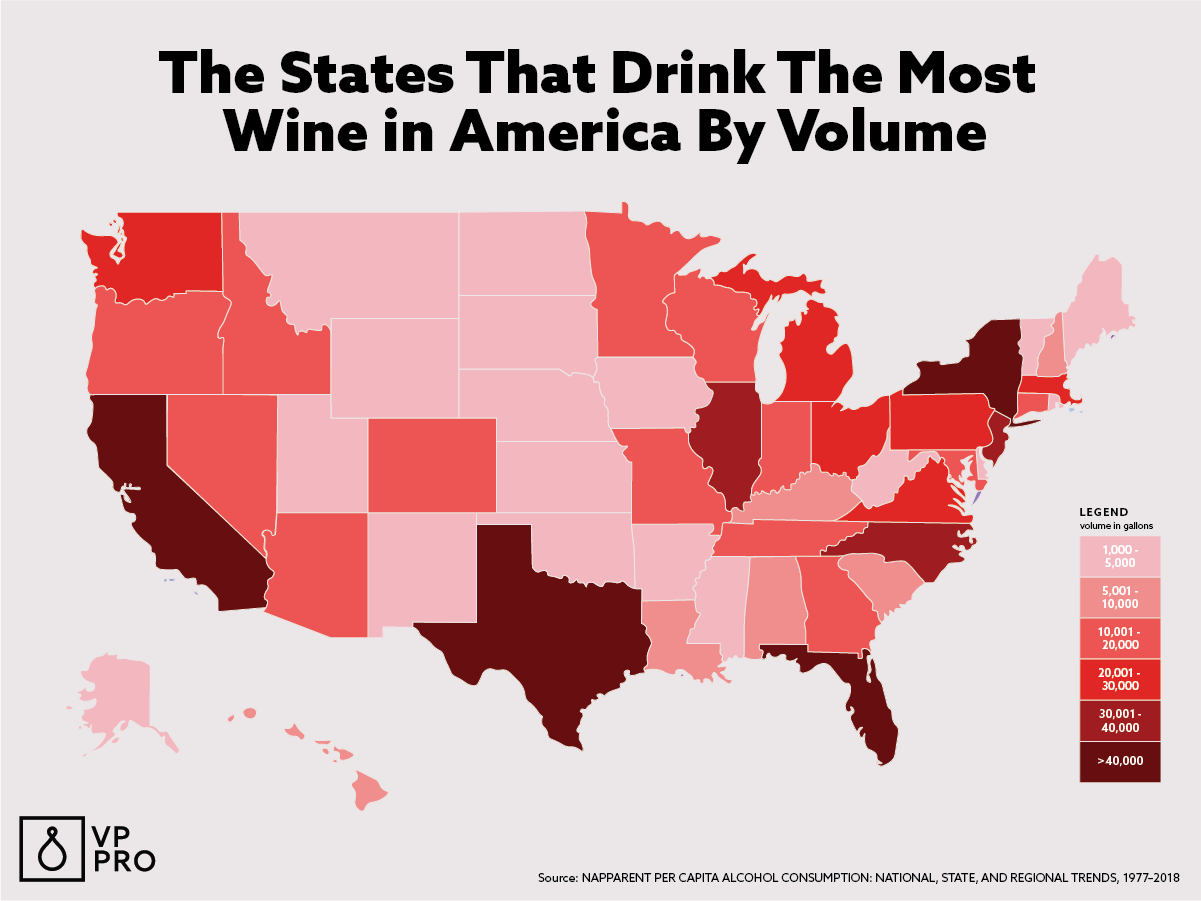
Californians drink the most wine by volume, which is unsurprising due to its size — and the fact that the state is responsible for 86 percent of America’s total wine output. New Hampshire seemingly out-drinks California and Oregon, but this is likely due to neighboring state residents crossing their respective borders for low-tax booze. (Interestingly, New Hampshire also takes first place for beer consumption.)
Nevertheless, recent data from the National Institute on Alcohol Abuse and Alcoholism yields some surprising results. Wondering how much wine your home state drinks? Read on to see VinePair’s color-coded maps depicting wine consumption per capita and by volume below.
THE STATES THAT DRINK THE MOST WINE PER CAPITA
While Idahoans drink the most wine per capita, residents of West Virginia, Kansas, and Mississippi prefer beer and spirits. Idaho residents drink 1.2 gallons of wine per capita, and while West Virginians, Kansans, and Mississippians drink less than 0.2 gallons of wine per capita, they drink about a gallon of beer and 2 gallons of spirits each year.
THE STATES THAT DRINK THE MOST WINE BY VOLUME
Unsurprisingly, the highly populated states of California, Florida, New York, and Texas top the list of states drinking the most wine overall — with Wyoming, West Virginia, and South Dakota drinking the least. Top to bottom, that’s a difference of 155.6 million gallons for California and 1.2 million gallons for South Dakota.
Ranking The States: Gallons Per Capita
| Rank | State | Gallons of Ethanol Per Capita* |
|---|---|---|
| 1 | Idaho | 1.21 |
| 2 | Washington, D.C. | 1.02 |
| 3 | New Hampshire | 0.84 |
| 4 | Vermont | 0.78 |
| 5 | Delaware | 0.72 |
| 6 | Massachusetts | 0.63 |
| 7 | California | 0.62 |
| 8 | Connecticut | 0.6 |
| 8 | Nevada | 0.6 |
| 10 | Hawaii | 0.59 |
| 11 | Oregon | 0.58 |
| 12 | Rhode Island | 0.57 |
| 12 | New Jersey | 0.57 |
| 14 | Alaska | 0.53 |
| 15 | Colorado | 0.52 |
| 15 | Florida | 0.52 |
| 15 | New York | 0.52 |
| 18 | Montana | 0.51 |
| 18 | Washington | 0.51 |
| 20 | Virginia | 0.49 |
| 21 | Illinois | 0.45 |
| 21 | North Carolina | 0.45 |
| 23 | Maine | 0.44 |
| 23 | Minnesota | 0.44 |
| 25 | Michigan | 0.40 |
| 26 | Arizona | 0.39 |
| 26 | Wisconsin | 0.39 |
| 26 | Maryland | 0.39 |
| 29 | Missouri | 0.38 |
| 30 | Louisiana | 0.34 |
| 30 | North Dakota | 0.34 |
| 30 | Texas | 0.34 |
| 33 | Pennsylvania | 0.33 |
| 34 | Tennessee | 0.32 |
| 34 | Wyoming | 0.32 |
| 36 | New Mexico | 0.31 |
| 36 | Ohio | 0.31 |
| 38 | Indiana | 0.29 |
| 39 | Alabama | 0.26 |
| 40 | Georgia | 0.25 |
| 40 | South Carolina | 0.25 |
| 42 | Arkansas | 0.23 |
| 42 | Iowa | 0.23 |
| 44 | Kentucky | 0.22 |
| 44 | South Dakota | 0.22 |
| 46 | Nebraska | 0.21 |
| 47 | Oklahoma | 0.20 |
| 47 | Utah | 0.20 |
| 49 | Mississippi | 0.18 |
| 50 | Kansas | 0.14 |
| 51 | West Virginia | 0.11 |
Ranking The States: Gallons Overall
| Rank | State | Gallons Overall |
|---|---|---|
| 1 | California | 155.6M |
| 2 | Florida | 72.7M |
| 3 | New York | 65.8M |
| 4 | Texas | 60.3M |
| 5 | Illinois | 37M |
| 6 | New Jersey | 33M |
| 7 | North Carolina | 30.2M |
| 8 | Massachusetts | 28.9M |
| 9 | Pennsylvania | 27.7M |
| 10 | Virginia | 27M |
| 11 | Michigan | 26M |
| 12 | Washington | 24.8M |
| 13 | Ohio | 23.2M |
| 14 | Colorado | 18.9M |
| 15 | Arizona | 17.7M |
| 16 | Georgia | 16.6M |
| 17 | Oregon | 15.7M |
| 17 | Minnesota | 15.7M |
| 19 | Missouri | 15M |
| 19 | Maryland | 15M |
| 21 | Wisconsin | 14.7M |
| 22 | Connecticut | 14M |
| 22 | Tennessee | 14M |
| 24 | Idaho | 13.2M |
| 25 | Indiana | 12.5M |
| 26 | Nevada | 11.7M |
| 27 | Louisiana | 9.9M |
| 28 | South Carolina | 8.2M |
| 29 | Alabama | 8.1M |
| 30 | New Hampshire | 7.6M |
| 31 | Kentucky | 6.2M |
| 32 | Hawaii | 5.4M |
| 33 | Oklahoma | 4.9M |
| 34 | Washington, D.C. | 4.7M |
| 35 | Iowa | 4.6M |
| 36 | Arkansas | 4.5M |
| 36 | Delaware | 4.5M |
| 38 | New Mexico | 4.2M |
| 39 | Rhode Island | 4M |
| 40 | Maine | 3.9M |
| 41 | Utah | 3.8M |
| 42 | Montana | 3.5M |
| 43 | Mississippi | 3.4M |
| 44 | Vermont | 3.2M |
| 45 | Kansas | 2.7M |
| 46 | Nebraska | 2.6M |
| 47 | Alaska | 2.4M |
| 48 | North Dakota | 1.6M |
| 49 | West Virginia | 1.3M |
| 50 | South Dakota | 1.2M |
| 50 | Wyoming | 1.2M |
*This data uses an estimate of average ethanol content of sold or shipped wine into gallons of ethanol (pure alcohol) before calculating per capita consumption estimates. For this data, the alcohol by volume value for wine is 0.129.
This story is a part of VP Pro, our free platform and newsletter for drinks industry professionals, covering wine, beer, liquor, and beyond. Sign up for VP Pro now!